
![[RSS]](./theme/image/rss.png)
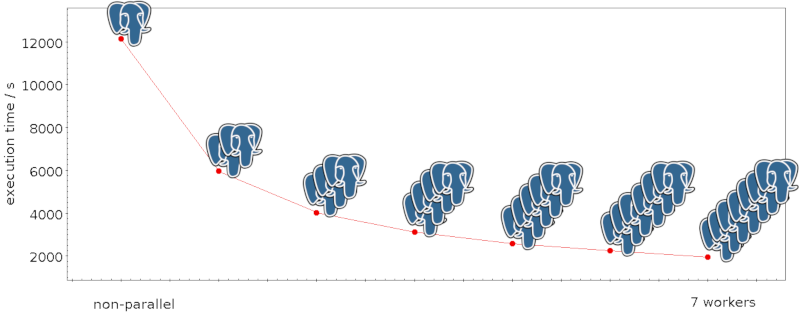
An experiment with parallel querying of PPMX, going from single-threaded execution to using seven workers.
Let me start this post with a TL;DR for
- scientists:
- Large analysis queries (like those that contain a GROUP BY clause) profit a lot from parallel execution, and you needn't do a thing for that.
- DaCHS operators:
- When you have large tables, Postgres 11 together with the next DaCHS release may speed up your responses quite dramatically in some cases.
So, here's the story –
I've finally overcome my stretch trauma and upgraded the Heidelberg data center's database server to Debian buster. With that, I got Postgres 11, and I finally bothered to look into what it takes to enable parallel execution of database queries.
Turns out: My Postgres started to do parallel execution right away, but just in case, I went for the following lines in postgresql.conf:
max_parallel_workers_per_gather = 4
max_worker_processes = 10
max_parallel_workers = 10
Don't quote me on this – I frankly admit I haven't really developed a feeling for the consequences of max_parallel_workers_per_gather and instead just did some experiments while the box was loaded otherwise, determining where raising that number has a diminishing return (see below for more on this).
The max_worker_processes thing, on the other hand, is an educated guess: on my data center, there's essentially never more than one person at a time who's running “interesting”, long-running queries (i.e., async), and that person should get the majority of the execution units (the box has 8 physical CPUs that look like 16 cores due to hyperthreading) because all other operations are just peanuts in comparison. I'll gladly accept advice to the effect that that guess isn't that educated after all.
Of course, that wasn't nearly enough. You see, since TAP queries can return rather large result sets – on the GAVO data center, the match limit is 16 million rows, which for a moderate row size of 2 kB already translates to 32 GB of memory use if pulled in at once, half the physical memory of that box –, DaCHS uses cursors (if you're a psycopg2 person: named cursors) to stream results and write them out to disk as they come in.
Sadly, postgres won't do parallel plans if it thinks people will discard a large part of the result anyway, and it thinks that if you're coming through a cursor. So, in SVN revision 7370 of DaCHS (and I'm not sure if I'll release that in this form), I'm introducing a horrible hack that, right now, just checks if there's a literal “group” in the query and doesn't use a cursor if so. The logic is, roughly: With GROUP, the result set probably isn't all that large, so streaming isn't that important. At the same time, this type of query is probably going to profit from parallel execution much more than your boring sequential scan.
This gives rather impressive speed gains. Consider this example (of course, it's selected to be extreme):
import contextlib
import pyvo
import time

@contextlib.contextmanager
def timeit(activity):
  start_time = time.time()
  yield
  end_time = time.time()
  print("Time spent on {}: {} s".format(activity, end_time-start_time))


svc = pyvo.tap.TAPService("http://dc.g-vo.org/tap")
with timeit("Cold (?) run"):
  svc.run_sync("select round(Rmag) as bin, count(*) as n"
    " from ppmx.data group by bin")
with timeit("Warm run"):
  svc.run_sync("select round(Rmag) as bin, count(*) as n"
    " from ppmx.data group by bin")
(if you run it yourself and you get warnings about VOTable versions from astropy, ignore them; I'm right and astropy is wrong).
Before enabling parallel execution, this was 14.5 seconds on a warm run, after, it was 2.5 seconds. That's an almost than a 6-fold speedup. Nice!
Indeed, that holds beyond toy examples. The showcase Gaia density plot:
SELECT
        count(*) AS obs,
        source_id/140737488355328 AS hpx
FROM gaia.dr2light
GROUP BY hpx
(the long odd number is 235416-6, which turns source_ids into level 6-HEALPixes as per Gaia footnote id; please note that Postgres right now isn't smart enough to parallelise ivo_healpix), which traditionally ran for about an hour is now done in less than 10 minutes.
In case you'd like to try things out on your postgres, here's what I've done to establish the max_parallel_workers_per_gather value above.
Find a table with a few 1e7 rows. Think of a query that will return a small result set in order to not confuse the measurements by excessive client I/O. In my case, that's a magnitude histogram, and the query would be:
select round(Rmag) as bin, count(*) as n from ppmx.data group by bin;
Run this query once so the data is in the disk cache (the query is “warm”).
Establish a non-parallel baseline. That's easy to do:
set max_parallel_workers_per_gather=0;
Then run:
explain analyze select round(Rmag) as bin, count(*) as n from ppmx.data group by bin;
You should see a simple query plan with the runtime for the non-parallel execution – in my case, a bit more than 12 seconds.
Then raise the number of max_parallel_workers_per_gatherer successively. Make sure the query plan has lines of the form “Workers Planned” or so. You should see that the execution time falls with the number of workers you give it, up to the value of max_worker_processes – or until postgres decides your table is too small to warrant further parallelisation, which for my settings happened at 7.
Note, though, that in realistic, more complex queries, there will probably be multiple operations that will profit from parallelisation in a single query. So, if in this trivial example you can go to 15 gatherers and still see an improvement, this could actually make things slower for complex queries. But as I said above: I have no instinct yet for how things will actually work out. If you have experiences to share: I'm sure I'm not the only person on dachs-users who't be interested.
Update 2022-05-17: In Postgres 13, I found that the planner disfavours parallel plans a lot stronger than I think it has in Postgres 11. To make up for that, I've amended my postgres configuration (in /etc/postgresql/13/main/postgresql.conf) with the slightly bizarre:
parallel_tuple_cost = 0.001
parallel_setup_cost = 3
This is certainly not ideal for every workload, but given the queries I see in the VO I want to give Postgres no excuse not to parallelise when there is at least the shard of a chance it'll help; given I'll never execute more than very few queries per second, the extra overhead for parallelising queries that would be faster sequentially will never really bite me.