GAVO at the AG-Tagung in Görlitz
Every year in early (meteorological) autumn, the venerable Astronomische Gesellschaft has its annual meeting, and since 2007, GAVO participates. This year's AG-Tagung takes place in Görlitz[1].
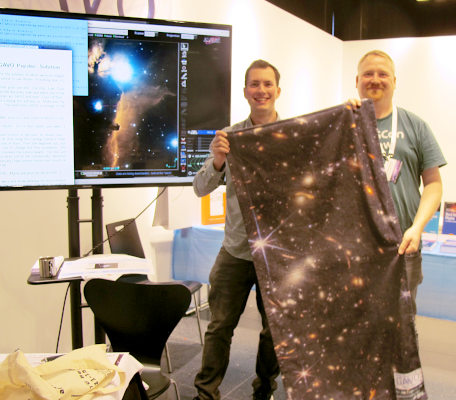
As every year, we brought a Puzzler, and again you can win a beautiful towel with an astronomical image (this time: Euclid's view of the Cat's Eye nebula). To increase participation, this year we are doing multiple choice:
In contrast to our puzzlers so far, this one is solvable with astronomical intuition alone, but of course the plan still is that you use the Virtual Observatory to work out the answer; on Thursday, I will tell you how right here in this post (and, of course, during the morning coffee break in Görlitz). As a special service to folks following us in the Fediverse, here are the complete hints towards this solution already.
Normally, you would have to come to our booth to pick up these hints, one per coffee break; but somewhat regrettably our booth is not easy to find, and it is not staffed most of the time, either.

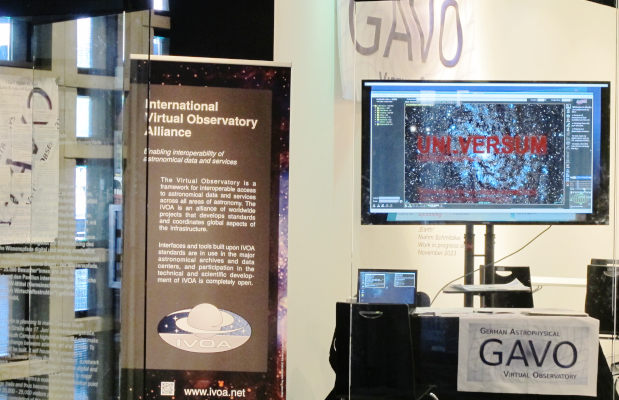
Our long-runner, the lame excuses poster (on the poster wall right next to the door), is again eliciting amusement at our Görlitz booth.
The background is that the venue in Görlitz is rather exotic: The plenaries take place in the (desecrated) old synagoge of Görlitz[2], and the exhibitors were placed in the „Sängerempore“, the singers' gallery (mainly because of fire code constraints, I'm told). Of course, the singer's gallery was designed so any sound in it carries to the main room, and that means that during the sessions, it needs to be silent up there. Hence, we don't do our traditional informal side meetings there, and there is none of my beloved VO show-and-tell either.
In the afternoon, splinter sessions are distributed over a significant part of the old town, and thus few people are near the synagoge in the first place. “Our” session, the one on E-Science and Machine Learning, took place at Schlesisches Museum, for instance. There, I reported on our experiences with our VO course and invited people to run one of these, too. My gut feeling at the end of the talk was that I will not hold my breath until the next full-semester VO course in presence takes place at a German university. But then perhaps a joint course, held online, is more realistic?

The plenaries are taking place below the exquisitely decorated dome of the old Görlitz synagogue.
The reason for the somewhat haphazard room situation is actually rather exciting: The institution hosting the conference does not really exist yet, in the sense that it does not have a large lecture hall and mainly exists a a suite of leased offices. It's the DZA (previously mentioned here), a future large (~1000 employees) astronomical institute to be built here in Görlitz. Given its existence in statu nascendi, I am rather impressed how well things work.
Later this year, by the way, I will be in a similar situation, as I am part of the LOC of the 2025 IVOA Interop. I sincerely hope things will work about as smooth then as they do now.
Followup (2025-09-18)
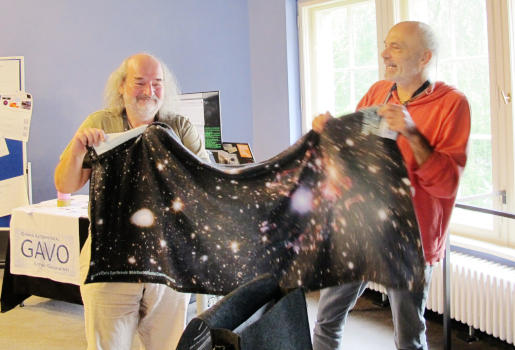
This year's winner of the puzzler prize will be well known to many of you:
I have also published the solution and updated the puzzlerweb accordingly.
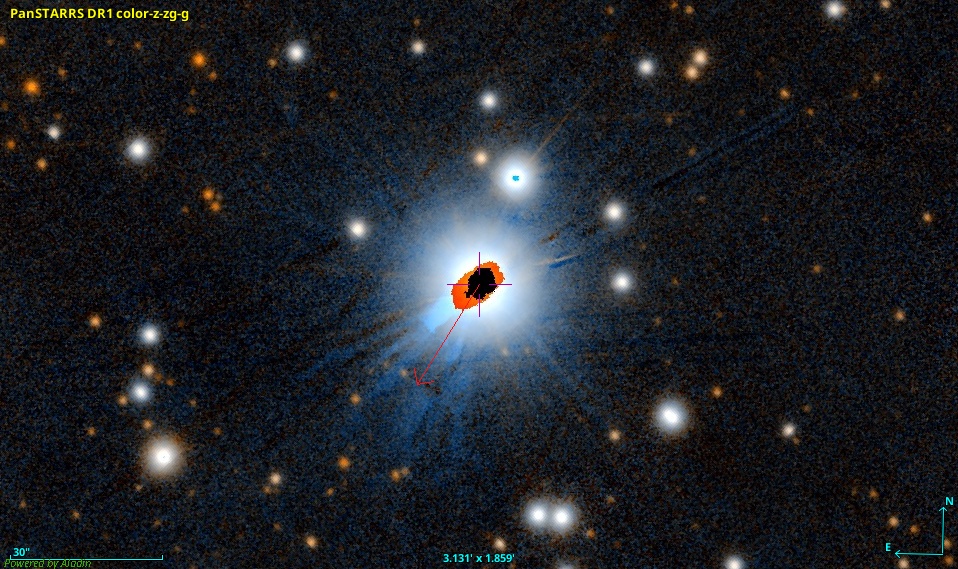
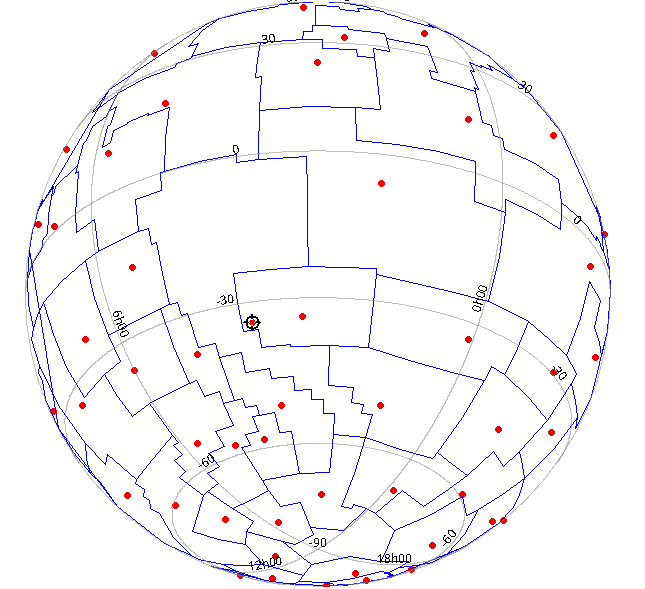
While polishing the solution, I noticed I should be advertising TOPCAT's ability to plot spherical geometries like polygons. So, the solution does that, and in a lame attempt to make you look, here's the image I came up with within a few seconds:
| [1] | Since last year's meeting was in Köln, you could suspect that we only meet in towns with ö. But no, the AG does not pick host cities by röck döts. Next year's meeting will not be in Göttingen, Würzburg, München, Günzburg, or Gräfenberg. It will be in Garching. Except… That town's official name happens to be Garching bei München. Oh my. Note that the conference language still is English, in case you are tempted to drop by. |
| [2] | The reason it is still there, by the way is rather simple: In 1938, when many Germans torched their neighbours' synagogues, in most cities the fire brigade basically stood by and at best made sure the fires did not spread. In Görlitz, they actually put the fire out. Which goes to show that the others could have done that as well. They just did not want to. |

![[RSS]](../theme/image/rss.png)


