![[RSS]](../theme/image/rss.png)
Doing Large-Scale ADQL Queries
You can do many interesting things with TAP and ADQL while just running queries returning a few thousand rows after a few seconds. Most examples you would find in tutorials are of that type, and when the right indexes exist on the queried tables, the scope of, let's say, casual ADQL goes far beyond toy examples.
Actually, arranging things such that you only fetch the data you need for the analysis at hand – and that often is not much more than the couple of kilobytes that go into a plot or a regression or whatever – is a big reason why TAP and ADQL were invented in the first place.
But there are times when the right indexes are not in place, or when you absolutely have to do something for almost everything in a large table. Database folks call that a sequential scan or seqscan for short. For larger tables (to give an order of magnitude: beyond 107 rows in my data centre, but that obviously depends), this means you have to allow for longer run times. There are even times when you may need to fetch large portions of such a large table, which means you will probably run into hard match limits when there is just no way to retrieve your full result set in one go.
This post is about ways to deal with such situations. But let me state already that having to go these paths (in particular the partitioning we will get to towards the end of the post) may be a sign that you want to re-think what you are doing, and below I am briefly giving pointers on that, too.
Raising the Match Limit
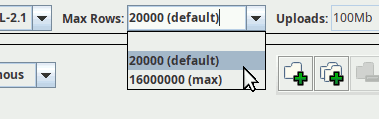
Most TAP services will not let you retrieve arbitrarily many rows in one go. Mine, for instance, at this point will snip results off at 20'000 rows by default, mainly to protect you and your network connection against being swamped by huge results you did not expect.
You can, and frequently will have to (even for an all-sky level 6 HEALPix map, for instance, as that will retrieve 49'152 rows), raise that match limit. In TOPCAT, that is done through a little combo box above the query input (you can enter custom values if you want):
If you are somewhat confident that you know what you are doing, there is nothing wrong with picking the maximum limit right away. On the other hand, if you are not prepared to do something sensible with, say, two million rows, then perhaps put in a smaller limit just to be sure.
In pyVO, which we will be using in the rest of this post, this is the maxrec argument to run_sync and its sibling methods on TAPService.
Giving the Query More Time
When dealing with non-trivial queries on large tables, you will often also have to give the query some extra time. On my service, for instance, you only have a few seconds of CPU time when your client uses TAP's synchronous mode (by calling TAPService.run_sync method). If your query needs more time, you will have to go async. In the simplest case, all that takes is write run_async rather than run_sync (below, we will use a somewhat more involved API; find out more about this in our pyVO course).
In async mode, you have two hours on my box at this point; this kind of time limit is, I think, fairly typical. If even that is not enough, you can ask for more time by changing the job's execution_duration parameter (before submitting it to the database engine; you cannot change the execution duration of a running job, sorry).
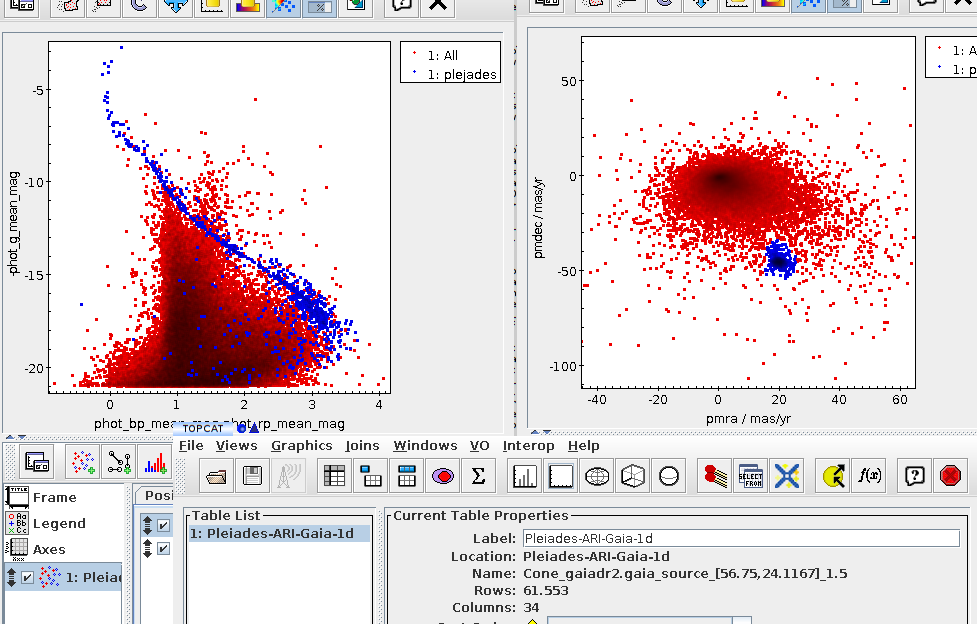
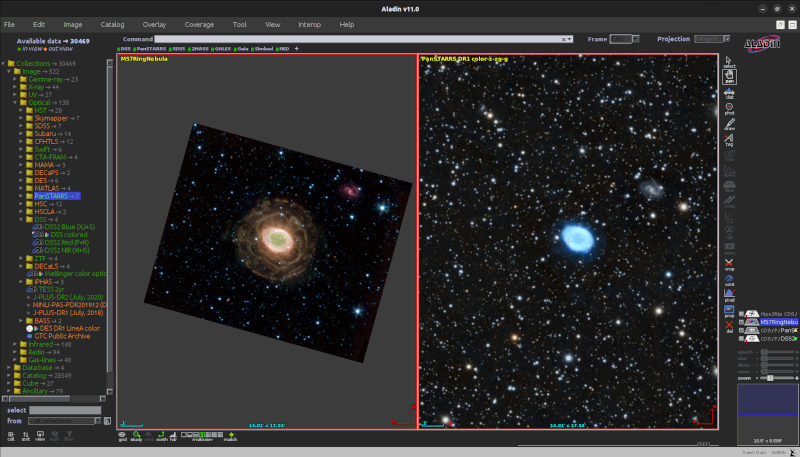
Let us take the example of a colour-magnitude diagram for stars in Gaia DR3 with distances of about 300 pc according to Bailer-Jones et al (2021); to make things a bit more entertaining, we want to load the result in TOPCAT without first downloading it locally; instead, we will transmit the result's URI directly to TOPCAT[1], which means that your code does not have to parse and re-package the (potentially large) data.
On the first reading, focus on the main function, though; the SAMP fun is for later:
import time
import pyvo

QUERY = """
SELECT
    source_id, phot_g_mean_mag, pseudocolour,
    pseudocolour_error, phot_g_mean_flux_over_error
FROM gedr3dist.litewithdist
WHERE
    r_med_photogeo between 290 and 310
    AND ruwe<1.4
    AND pseudocolour BETWEEN 1.0 AND 1.8
"""

def send_table_url_to_topcat(conn, table_url):
    client_id = pyvo.samp.find_client_id(conn, "topcat")
    message = {
        "samp.mtype": "table.load.votable",
        "samp.params": {
            "url": table_url,
            "name": "TAP result",}
    }
    conn.notify(client_id, message)


def main():
    svc = pyvo.dal.TAPService("http://dc.g-vo.org/tap")
    job = svc.submit_job(QUERY, maxrec=3000)
    try:
        job.execution_duration=10000  # that's 10000 seconds
        job.run()
        job.wait()
        assert job.phase=="COMPLETED"

        with pyvo.samp.connection(addr="127.0.0.1") as conn:
            send_table_url_to_topcat(conn, job.result_uri)
    finally:
        job.delete()

if __name__=="__main__":
    main()
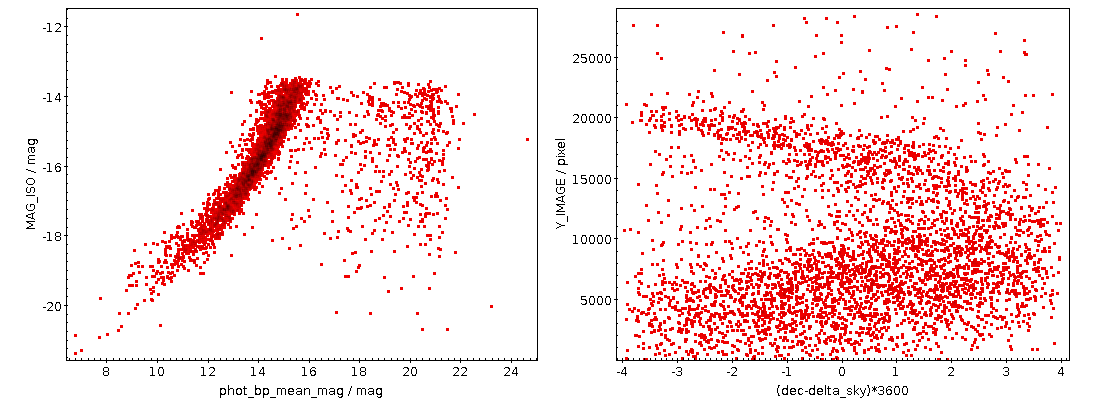
As written, this will be fast thanks to maxrec=3000, and you wouldn't really have to bother with async just yet. The result looks nicely familiar, which means that in that distance range, the Bailer-Jones distances are pretty good:
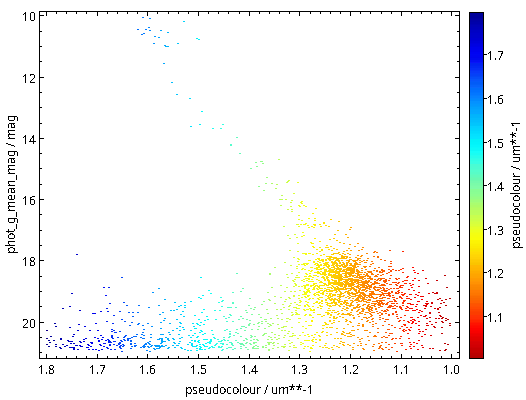
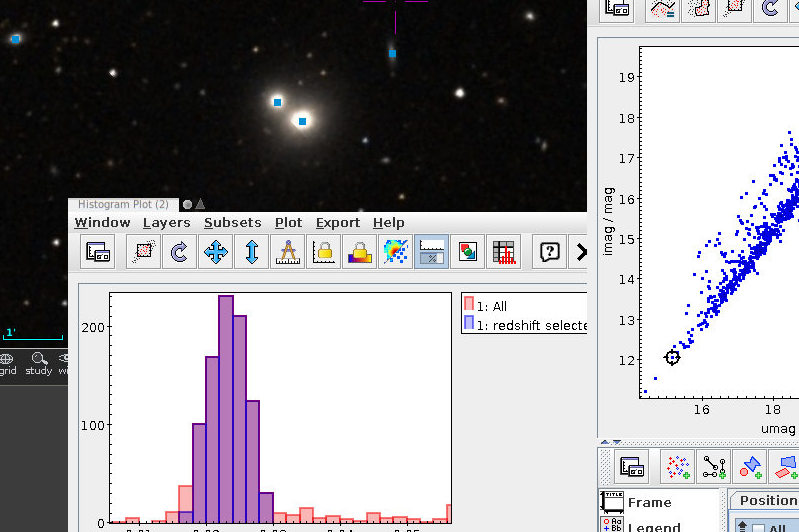
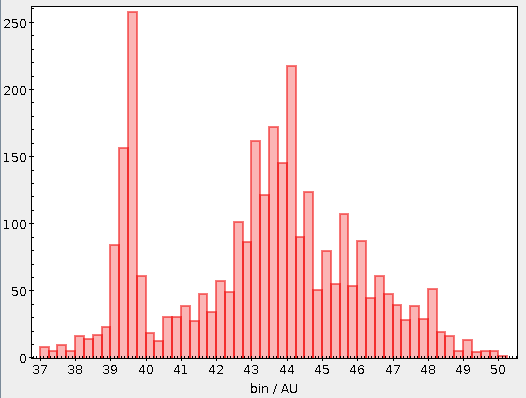
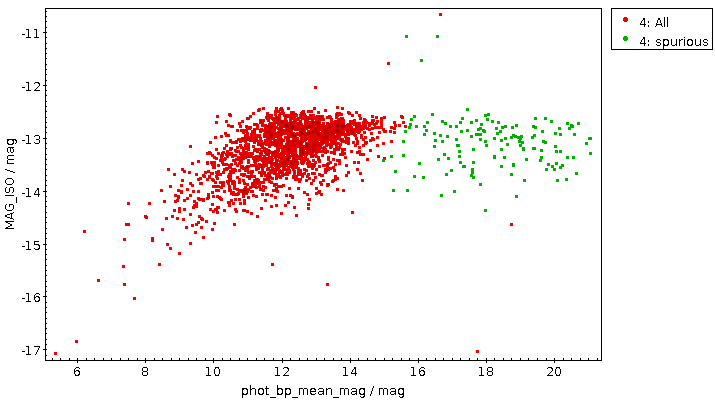
Now raise the match limit to 30000, and you will already need async. Here is what the result looks like:
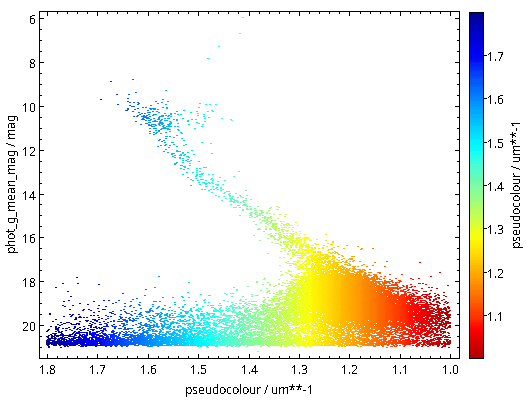
Ha! Numbers matter: at least we are seeing a nice giant branch now! And of course the dot colours do not represent the colours of the stars with the respective pseudocolour; the directions of blue and red are ok, but most of what you are seeing here will look rather ruddy in reality.
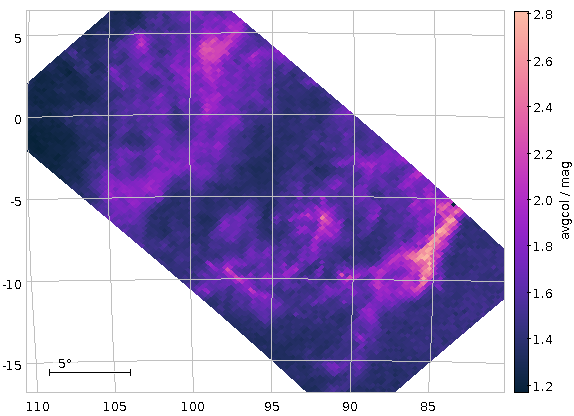
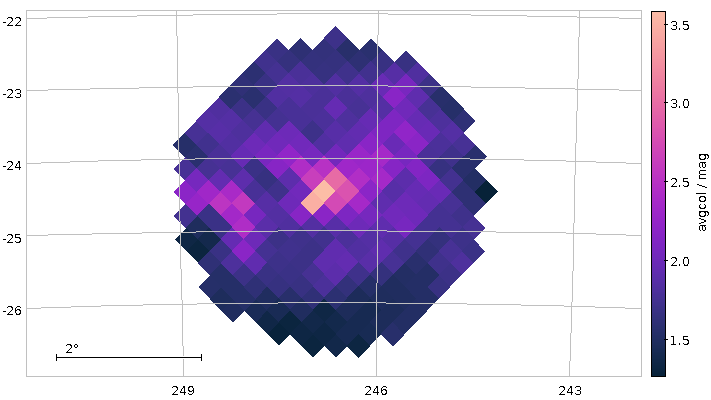
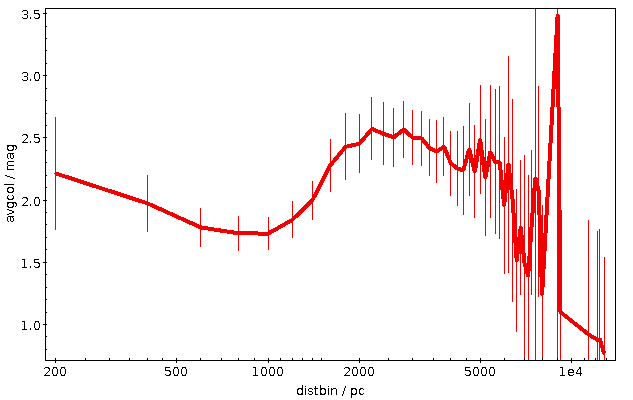
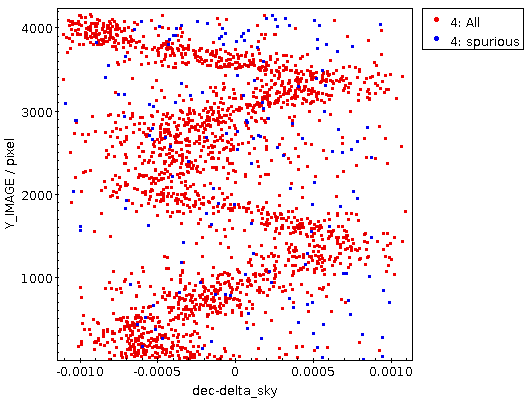
You will not really need to change execution_duration here, nor will you need it even when setting maxrec=1000000 (or anything more, for that matter, as the full result set size is 330'545), as that ends up finishing within something like ten minutes. Incidentally, the result for the entire 300 pc shell, now as a saner density plot, looks like this:
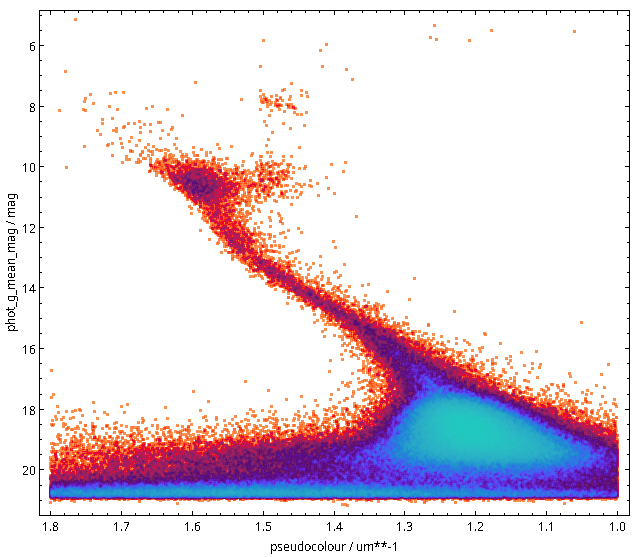
Ha! Numbers matter even more. There is now even a (to me surprisingly clear) horizontal branch in the plot.
Planning for Large Result Sets? Get in Contact!
Note that if you were after a global colour-magnitude diagram as the one I have just shown, you should probably do server-side aggregation (that is: compute the densities in a few hundred or thousand bins on the server and only retrieve those then) rather than load ever larger result sets and then have the aggregation be performed by TOPCAT. More generally, it usually pays to try and optimise ADQL queries that are slow and have huge result sets before fiddling with async and, even more, with partitioning.
Most operators will be happy to help you do that; you will find some contact information in TOPCAT's service tab, for instance. In pyVO, you could use the get_contact method of the objects you get back from the Registry API[2]:
>>> pyvo.registry.search(ivoid="ivo://org.gavo.dc/tap")[0].get_contact()
'GAVO Data Centre Team (+49 6221 54 1837) <gavo@ari.uni-heidelberg.de>'
That said: sometimes neither optimisation nor server-side aggregation will do it: You just have to pull more rows than the service's match limit. You see, most servers will not let you pull billions of rows in one go. Mine, for instance, will cap the maxrec at 16'000'000. What you need to do if you need to pull more than that is chunking up your query such that you can process the whole sky (or whatever else huge thing makes the table large) in manageable chunks. That is called partitioning.
Uniform-Length Partitions
To partition a table, you first need something to partition on. In database lingo, a good thing to partition on is called a primary key, typically a reasonably short string or, even better, an integer that maps injectively to the rows (i.e., not two rows have the same key). Let's keep Gaia as an example: the primary key designed for it is the source_id.
In the simplest case, you can “uniformly” partition between 0 and the largest source_id, which you will find by querying for the maximum:
SELECT max(source_id) FROM gaia.dr3lite
This should be fast. If it is not, then there is likely no sufficiently capable index on the column you picked, and hence your choice of the primary key probably is not a good one. This would be another reason to turn to the service's contact address as above.
In the present case, the query is fast and yields 6917528997577384320. With that number, you can write a program like this to split up your problem into N_PART sub-problems:
import pyvo

MAX_ID, N_PART = 6917528997577384320+1, 100
partition_limits = [(MAX_ID//N_PART)*i
  for i in range(N_PART+1)]

svc = pyvo.dal.TAPService("http://dc.g-vo.org/tap")
main_query = "SELECT count(*) FROM ({part}) AS q"

for lower, upper in zip(partition_limits[:-1], partition_limits[1:]):
  result = svc.run_sync(main_query.format(part=
    "SELECT * FROM gaia.dr3lite"
    "  WHERE source_id BETWEEN {} and {} ".format(lower, upper-1)))
  print(result)
Exercise: Can you see why the +1 is necessary in the MAX_ID assignment?
This range trick will obviously not work when the primary key is a string; I would probably partition by first letter(s) in that case.
Equal-Size Partitions
However, this is not the end of the story. Gaia's (well thought-out) enumeration scheme reflects to a large degree sky positions. So do, by the way, the IAU conventions for object designations. Since most astronomical objects are distributed highly unevenly on the sky, creating partitions with of equal size in identifier space will yield chunks of dramatically different (a factor of 100 is not uncommon) sizes in all-sky surveys.
In the rather common event that you have a use case in which you need a guaranteed maximum result size per partition, you will therefore have to use two passes, first figuring out the distribution of objects and then computing the desired partition from that.
Here is an example for how one might go about this:
from astropy import table
import pyvo

MAX_ID, ROW_TARGET = 6917528997577384320+1, 10000000

ENDPOINT = "http://dc.g-vo.org/tap"

# the 10000 is just the number of bins to use; make it too small, and
# your inital bins may already overflow ROW_TARGET
ID_DIVISOR = MAX_ID/10000

DISTRIBUTION_QUERY = f"""
select round(source_id/{ID_DIVISOR}) as bin, count(*) as ct
from gaia.dr3lite
group by bin
"""


def get_bin_sizes():
  """returns a ordered sequence of (bin_center, num_objects) rows.
  """
  # since the partitioning query already is expensive, cache it,
  # and use the cache if it's there.
  try:
    with open("partitions.vot", "rb") as f:
      tbl = table.Table.read(f)
  except IOError:
    # Fetch from source; takes about 1 hour
    print("Fetching partitions from source; this will take a while"
      " (provide partitions.vot to avoid re-querying)")
    svc = pyvo.dal.TAPService(ENDPOINT)
    res = svc.run_async(DISTRIBUTION_QUERY, maxrec=1000000)
    tbl = res.table
    with open("partitions.vot", "wb") as f:
      tbl.write(output=f, format="votable")

  res = [(row["bin"], row["ct"]) for row in tbl]
  res.sort()
  return res


def get_partition_limits(bin_sizes):
  """returns a list of limits of source_id ranges exhausting the whole
  catalogue.

  bin_sizes is what get_bin_sizes returns (and it must be sorted by
  bin center).
  """
  limits, cur_count = [0], 0
  for bin_center, bin_count in bin_sizes:
    if cur_count+bin_count>MAX_ROWS:
      limits.append(int(bin_center*ID_DIVISOR-ID_DIVISOR/2))
      cur_count = 0
    cur_count += bin_count
  limits.append(MAX_ID)
  return limits


def get_data_for(svc, query, low, high):
  """returns a TAP result for the (simple) query in the partition
  between low and high.

  query needs to query the ``sample`` table.
  """
  job = svc.submit_job("WITH sample AS "
    "(SELECT * FROM gaia.dr3lite"
    "  WHERE source_id BETWEEN {} and {}) ".format(lower, upper-1)
    +query, maxrec=ROW_TARGET)
  try:
    job.run()
    job.wait()
    return job.fetch_result()
  finally:
    job.delete()


def main():
  svc = pyvo.dal.TAPService(ENDPOINT)
  limits = get_partition_limits(get_bin_sizes())
  for ct, (low, high) in enumerate(zip(limits[:-1], limits[1:])):
    print("{}/{}".format(ct, len(limits)))
    res = get_data_for(svc, <a query over a table sample>, low, high-1)
    # do your thing here
But let me stress again: If you think you need partitioning, you are probably doing it wrong. One last time: If in any sort of doubt, try the services' contact addresses.
| [1] | Of course, if you are doing long-running queries, you probably will postpone the deletion of the service until you are sure you have the result wherever you want it. Me, I'd probably print the result URL (for when something goes wrong on SAMP or in TOPCAT) and a curl command line to delete the job when done. Oh, and perhaps a reminder that one ought to execute the curl command line once the data is saved. |
| [2] | Exposing the contact information in the service objects themselves would be a nice little project if you are looking for contributions you could make to pyVO; you would probably do a natural join between the rr.interface and the rr.res_role tables and thus go from the access URL (you generally don't have the ivoid in pyVO service objects) to the contact role. |