Articles from Demo

  • Towards Data Discovery in pyVO

    When I struggled with ways to properly integrate TAP services – which may have hundreds or thousands of different resources in one service – into the VO Registry without breaking what we already had, I realised that there are really two fundamentally different modes of using the VO Registry. In Discovering Data Collections's abstract I wrote:

    the Registry must support both VO-wide discovery of services by type ("service enumeration") and discovery by data collection ("data discovery").

    To illustrate the difference in a non-TAP case, suppose I have archived images of lensed quasars from Telescopes A, B, and C. All these image collections are resources in their own right and should be separately findable when people look for “resources with data from Telescope A“ or perhaps “images obtained between 2011-01-01 and 2011-12-31”.

    However, when a machine wants to find all images at a certain position, publishing the three resources through three different services would mean that that machine has to do three requests where one would work just as well. That is very relevant when you think about how the VO will evolve: At this point there are 342 SIAP services in the VO, and when you read this, that number may have grown further. Adding one service per collection will simply not scale when we want to keep the possibility of all-VO searches. Since I claim that is a very desirably thing, we need to enable collective services covering multiple subordinate resources.

    So, while in the first (“data discovery”) case one wants to query (or at least discover) the three resources separately, in the second case they should be ignored, and only a collective “images of lensed quasars” service should be queried.

    The technical solution to this requirement was creating “auxliary capabilities” as discribed in the endorsed note on discoving data collections cited above. But these of course need client support; VO clients up to now by and large do service enumeration, as that has been what we started with in the VO Registry. Client support would, roughly, mean that clients would present their users with data collections, and then offer the various ways to to access them.

    There are quite a number of technicalities involved in why that's not terribly straightforward for the “big” clients like TOPCAT and Aladin (though Aladin's discovery tree already comes rather close).

    Now that quite a number of people use pyVO interactively in jupyter notebooks, extending pyVO's registry interface to do data discovery in addition to the conventional service enumeration becomes an attractive target to have data discovery in practice.

    I have hence created pyVO PR #289. I think some the rough edges will need to be smoothed out before it can be merged, but meanwhile I'd be grateful if you could try it out already. To facilitate that, I have prepared a jupyter notebook that shows the basic ideas.

    Followup (2023-12-15)

    I have just prepared a slightly updated version of the notebook.

    To run it while the PR is not merged, you need to install the forked pyVO. In order to not clobber your main installation, you can install astropy using your package manager and then do the following (assuming your shell is bash or something suitably similar):

    virtualenv --system-site-packages try-discoverdata
    . try-discoverdata/bin/activate
    cd try-discoverdata
    git clone https://github.com/msdemlei/pyvo
    cd pyvo
    git checkout add-discoverdata
    python3 setup.py develop
    ipython3 notebook
    

    That should open a browser window in which you can open the notebook (you probably want to download it into the pyvo checkout in order to make the notebook selector see it). Enjoy!

  • Spectral Units in ADQL

    math formulae.

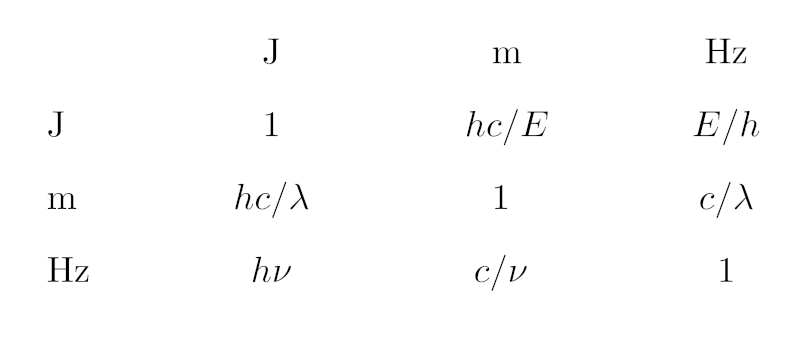
    In case you find the piece of Python given below too hard to read: It's just this table of conversion expressions between the different SI units we are dealing with here.

    Astronomers these days work all along the electromagnetic spectrum (and beyond, of course). Depending on where they observe, they will have very different instrumentation, and hence some see their messengers very naturally as waves, others quite as naturally as particles, others just as electrons flowing out of a CCD that is sitting behind a filter.

    In consequence, when people say where in the spectrum they are, they use very different notions. A radio astronomer will say “I'm observing at 21 cm” or “at 50 GHz“. There's an entire field named after a wavelength, “submillimeter“, and blueward of that people give their bands in micrometers. Optical astronomers can't be cured of their Ångström habit. Going still more high-energy, after an island of nanometers in the UV you end up in the realm of keV in X-ray, and then MeV, GeV, TeV and even EeV.

    However, there is just one VO (or at least that's where we want to go). Historically, the VO has had a slant towards optical astronomy, which gives us the legacy of having wavelengths in far too many places, including Obscore. Retrospectively, this was an unfortunate choice not only because it makes us look optical bigots, but in particular because in contrast to energy and, by ν = E/h, frequency, messenger wavelength depends on the medium you work in, and I shudder to think how many wavelengths in my data center actually are air wavelengths rather than vacuum wavelengths. Also, as you go beyond photons, energy really is the only thing that reasonably characterises all messengers alike (well, even that still isn't quite settled for gravitational waves as long as we're not done with a quantum theory of gravitation).

    Well – the wavelength milk is spilled. Still, the VO has been boldly expanding its reach beyond the optical and infrared windows (recently, with neutrinos and gravitational waves, not to mention EPN-TAP's in-situ measurements in the solar system, even beyond the electromagnetic spectrum). Which means we will have to accomodate the various customs regarding spectral units described above. Where there are “thick” user interfaces, these can care about that. For instance, my datalink XSLT and javascript lets people constrain spectral cutouts (along BAND) in a variety of units (Example).

    But what if the UI is as shallow as it is in ADQL, where you deal with whatever is in the underlying database tables? This has come up again at last week's EuroVO Technology Forum in virtual Strasbourg in the context of making Obscore more attractive to radio astronomers. And thus I've sat down and taught DaCHS a new user defined function to address just that.

    Up front: When you read this in 2022 or beyond and everything has panned out, the function might be called ivo_specconv already, and perhaps the arguments have changed slightly. I hope I'll remember to update this post accordingly. If not, please poke me to do so.

    The function I'm proposing is, mainly, gavo_specconv(expr, target_unit). All it does is convert the SQL expression expr to the (spectral) target_unit if it knows how to do that (i.e., if the expression's unit and the target unit are spectral units properly written in VOUnit) and raise an error otherwise.

    So, you can now post:

    SELECT TOP 5 gavo_specconv(em_min, 'GHz') AS nu
    FROM ivoa.obscore
    WHERE gavo_specconv((em_min+em_max)/2, 'GHz')
        BETWEEN 1 AND 2
      AND obs_collection='VLBA LH sources'
    

    to the TAP service at http://dc.g-vo.org/tap. You will get your result in GHz, and you write your constraint in GHz, too. Oh, and see below on the ugly constraint on obs_collection.

    Similarly, an X-ray astronomer would say, perhaps:

    SELECT TOP 5 access_url, gavo_specconv(em_min, 'keV') AS energy
    FROM ivoa.obscore
    WHERE gavo_specconv((em_min+em_max)/2, 'keV')
      BETWEEN 0.5 AND 2
      AND obs_collection='RASS'
    

    This works because the ADQL translator can figure out the unit of its first argument. But, perhaps regrettably, ADQL has no notion of literals with units, and so there is no way to meaningfully say the equivalent of gavo_specconv(656, 'Hz') to get Hα in Hz, and you will receive a (hopefully helpful) error message if you try that.

    However, this functionality is highly desirable not the least because the queries above are fairly inefficient. That's why I added the funny constraints on the collection: without them, the queries will take perhaps half a minute and thus require async operation on my box.

    The (fundamental) reason for that is that postgres is not smart enough to work out it could be using an index on em_min and em_max if it sees something like nu between 3e8/em_min and 3e7/em_max by re-writing the constraint into 3e8/nu between em_min and em_max (and think really hard about whether this is equivalent in the presence of NULLs). To be sure, I will not teach that to my translation layer either. Not using indexes, however, is a recipe for slow queries when the obscore table you query has about 85 million rows (hi there in 2050: yes, that was a sizable table in our day).

    To let users fix what's too hard for postgres (or, for that matter, the translation engine when it cannot figure out units), there is a second form of gavo_specconv that takes a third argument: gavo_specconv(expr, unit_of_expr, target_unit). With that, you can write queries like:

    SELECT TOP 5 gavo_specconv(em_min, 'Angstrom') AS nu
    FROM ivoa.obscore
    WHERE gavo_specconv(5000, 'Angstrom', 'm')
      BETWEEN em_min AND em_max
    

    and hope the planner will use indexes. Full disclosure: Right now, I don't have indexes on the spectral limits of all tables contributing to my obscore table, so this particular query only looks fast because it's easy to find five datasets covering 500 nm – but that's an oversight I'll fix soon.

    Of course, to make this functionality useful in practice, it needs to be available on all obscore services (say) – only then can people run all-VO obscore searches without the optical bias. The next step (before Bambi-eyeing the TAP implementors) therefore would be to get it into the catalogue of ADQL user defined functions.

    For this, one would need to specify a bit more carefully what units must minimally be supported. In DaCHS, I have built this on a full implementation of VOUnits, which means you can query using attoparsecs of wavelength and get your result in dekaerg (which is a microjoule: 1 daerg = 1 uJ in VOUnits – don't you just love this?):

    SELECT gavo_specconv(
      (spectral_start+spectral_end)/2, 'daerg')
      AS energy
    FROM rr.stc_spectral
    WHERE gavo_specconv(0.0002, 'apc', 'J')
      BETWEEN spectral_start AND spectral_end
    

    (stop computing: an attoparsec is about 3 cm). This, incidentally, queries the draft RegTAP extension for the VODataService 1.2 coverage in space, time, and spectrum, which is another reason I'm proposing this function: I'm not quite sure how well my rationale that using Joules of energy is equally inconvenient for all communities will be generally received. The real rationale – that Joule is the SI unit for energy – I don't dare bring forward in the first place.

    Playing with wavelengths in AU (you can do that, too; note, though, that VOUnit forbids prefixes on AU, so don't even try mAU) is perhaps entertaining in a slightly twisted way, but admittedly poses a bit of a challenge in implementation when one does not have full VOUnits available. I'm currently thinking that m, nm, Angstrom, MHz, GHz, keV and MeV (ach! No Joule! But no erg, either!) plus whatever spectral units are in use in the local tables would about cover our use cases. But I'd be curious what other people think.

    Since I found the implementation of this a bit more challenging than I had at first expected, let me say a few words on how the underlying code works; I guess you can stop reading here unless you are planning to implement something like this.

    The fundamental trouble is that spectral conversions are non-linear. That means that what I do for ADQL's IN_UNIT – just compute a conversion factor and then multiply that to whatever expression is in its first argument – will not work. Instead, one has to write a new expression. And building these expressions becomes involved because there are thousands of possible combinations of input and output units.

    What I ended up doing is adopting standard (i.e., SI) units for energy (J), wavelength (m), and frequency (Hz) as common bases, and then first convert the source and target units to the applicable standard unit. This entails trying to convert each input unit to each standard unit until a conversion actually works, which in DaCHS' Python looks like this:

    def toStdUnit(fromUnit):
        for stdUnit in ["J", "Hz", "m"]:
            try:
                 factor = base.computeConversionFactor(
                     fromUnit, stdUnit)
            except base.IncompatibleUnits:
                continue
            return stdUnit, factor
    
        raise common.UfuncError(
            f"specconv: {fromUnit} is not a spectral unit understood here")
    

    The VOUnits code is hidden away in base.computeConversionFactor, which raises an IncompatibleUnits when a conversion is impossible; hence, in the end, as a by-product this function also determines what kind of spectral value (energy, frequency, or wavelength) I am dealing with.

    That accomplished, all I need to do is look up the conversions between the basic units, which can be done in a single dictionary mapping pairs of standard units to the conversion expression templates. I have not tried to make these templates particularly pretty, but if you squint, you can still, I hope, figure out this is actually what the opening image shows:

    SPEC_CONVERSION = {
        ("J", "m"): "h*c/(({expr})*{f})",
        ("J", "Hz"): "({expr})*{f}/h",
        ("J", "J"): "({expr})*{f}",
        ("Hz", "m"): "c/({expr})/{f}",
        ("Hz", "Hz"): "{f}*({expr})",
        ("Hz", "J"): "h*{f}*({expr})",
        ("m", "m"): "{f}*({expr})",
        ("m", "Hz"): "c/({expr})/{f}",
        ("m", "J"): "h*c/({expr})/{f}",}
    

    expr is (conceptually) replaced by the first argument of the UDF, and f is the conversion factor between the input unit and the unit expr is in. Note that thankfully, no additive operators are involved and thus all this is numerically well-conditioned. Hence, I can afford not attempting to simplify any of the expressions involved.

    The rest is essentially book-keeping, where I'm using the ADQL parser to turn the expression into a tree fragment and then fiddling in the tree fragment for expr into that. The result then replaces the UDF function call in the syntax tree. You can review all this in context in DaCHS' ufunctions.py, starting at the definition of toStdUnit.

    Sure: this is no Turing award material. But perhaps these notes are useful when people want to put this kind of thing into their ADQL engines. Which I'd consider a Really Good Thing™.

  • Crazy Shapes in TAP

    OpenNGC shapes

    A complex shape from OpenNGC: MOCs need not be convex, or simply connected, or anything.

    So far when you did spherical geometry in ADQL, you had points, circles, and polygons as data types, and you could test for intersection and containment as operations. This feature set is a bit unsatisfying because there are no (algebraic) groups in this picture: When you join or intersect two circles, the result only is a circle if one contains the other. With non-intersecting polygons, you will again not have a (simply connected) spherical polygon in the end.

    Enter MOCs (which I've mentioned a few times before on this blog): these are essentially arbitrary shapes on the sky, in practice represented through lists of pixels, cleverly done so they can be sufficiently precise and rather compact at the same time. While MOCs are powerful and surprisingly simple in practice, ADQL doesn't know about them so far, which limits quite a bit what you can do with them. Well, DaCHS would serve them since about 1.3 if you managed to push them into the database, but there were no operations you could do on them.

    Thanks to work done by credativ (who were really nice to work with), funded with some money we had left from our previous e-inf-astro project (BMBF FKZ 05A17VH2) on the pgsphere database extension, this has now changed. At least on the GAVO data center, MOCs are now essentially first-class citizens that you can create, join, and intersect within ADQL, and you can retrieve the results. All operators of DaCHS services are just a few updates away from being able to offer the same.

    So, what can you do? To follow what's below, get a sufficiently new TOPCAT (4.7 will do) and open its TAP client on http://dc.g-vo.org/tap (a.k.a. GAVO DC TAP).

    Basic MOC Operations in TAP

    First, let's make sure you can plot MOCs; run

    SELECT name, deepest_shape
    FROM openngc.shapes
    

    Then do Graphics/Sky Plot, and in the window that pops up then, Layers/Add Area Control. Then select your new table in the Position tab, and finally choose deepest_shape as area (yeah, this could become a bit more automatic and probably will over time). You will then see the footprints of a few NGC objects (OpenNGC's author Mattia Verga hasn't done all yet; he certainly welcomes help on OpenNGC's version control repo), and you can move around in the plot, yielding perhaps something like Fig. 1.

    Now let's color these shapes by object class. If you look, openngc.data has an obj_type column – let's group on it:

    SELECT
      obj_type,
      shape,
      AREA(shape) AS ar
    FROM (
      SELECT obj_type, SUM(deepest_shape) AS shape
      FROM openngc.shapes
      NATURAL JOIN openngc.data
      GROUP BY obj_type) AS q
    

    (the extra subquery is a workaround necessary because the area function wants a geometry or a column reference, and ADQL doesn't allow aggregate functions – like sum – as either of these).

    In the result you will see that so far, contours for about 40 square degrees of star clusters with nebulae have been put in, but only 0.003 square degrees of stellar associations. And you can now plot by the areas covered by the various sorts of objects; in Fig. 2, I've used Subsets/Classify by Column in TOPCAT's Row Subsets to have colours indicate the different object types – a great workaround when one deals with categorial variables in TOPCAT.

    MOCs and JOINs

    Another table that already has MOCs in them is rr.stc_spatial, which has the coverage of VO resources (and is the deeper reason I've been pushing improved MOC support in pgsphere – background); this isn't available for all resources yet , but at least there are about 16000 in already. For instance, here's how to get the coverage of resources talking about planetary nebulae:

    SELECT ivoid, res_title, coverage
    FROM rr.subject_uat
      NATURAL JOIN rr.stc_spatial
      NATURAL JOIN rr.resource
    WHERE uat_concept='planetary-nebulae'
      AND AREA(coverage)<20
    

    (the rr.subject_uat table is a local extension to RegTAP that will be the subject of some future blog post; you could also use rr.res_subject, but because people still use wildly different keyword schemes – if any –, that wouldn't be as much fun). When plotted, that's the left side of Fig. 3. If you do that yourself, you will notice that the resolution here is about one degree, which is a special property of the sort of MOCs I am proposing for the Registry: They are of order 6. Resolution in MOC goes up with order, doubling with every step. Thus MOCs of order 7 have a resolution of about half a degree, MOCs of order 5 a resolution of about two degrees.

    One possible next step is fetch the intersection of each of these coverages with, say, the DFBS (cf. the post on Byurakan spectra). That would look like this:

    SELECT
      ivoid,
      res_title,
      gavo_mocintersect(coverage, dfbscoverage) as ovrlp
    FROM (
      SELECT ivoid, res_title, coverage
      FROM rr.subject_uat
      NATURAL JOIN rr.stc_spatial
      NATURAL JOIN rr.resource
      WHERE uat_concept='planetary-nebulae'
      AND AREA(coverage)<20) AS others
    CROSS JOIN (
      SELECT coverage AS dfbscoverage
      FROM rr.stc_spatial
      WHERE ivoid='ivo://org.gavo.dc/dfbsspec/q/spectra') AS dfbs
    

    (the DFBS' identifier I got with a quick query on WIRR). This uses the gavo_mocintersect user defined function (UDF), which takes two MOCs and returns a MOC of their common pixels. Which is another important part why MOCs are so cool: together with union and intersection, they form groups. It should not come as a surprise that there is also a gavo_mocunion UDF. The sum aggregate function we've used in our grouping above is (conceptually) built on that.

    Planetary Nebula footprint and plate matches

    Fig. 3: Left: The common footprint of VO resources declaring a subject of planetary-nebula (and declaring a footprint). Right bottom: Heidelberg plates intersecting this, and, in blue, level-6 intersections. Above this, an enlarged detail from this plot.

    You can also convert polygons and circles to MOCs using the (still DaCHS-only) MOC constructor. For instance, you could compute the coverage of all resources dealing with planetary nebulae, filtering against obviously over-eager ones by limiting the total area, and then match that against the coverages of images in, say, the Königstuhl plate achives HDAP. Watch this:

    SELECT
      im.*,
      gavo_mocintersect(MOC(6, im.coverage), pn_coverage) as ovrlp
    FROM (
      SELECT SUM(coverage) AS pn_coverage
      FROM rr.subject_uat
      NATURAL JOIN rr.stc_spatial
      WHERE uat_concept='planetary-nebulae'
      AND AREA(coverage)<20) AS c
    JOIN lsw.plates AS im
    ON 1=INTERSECTS(pn_coverage, MOC(6, coverage))
    

    – so, the MOC(order, geo) function should give you a MOC for other geometries. There are limits to this right now because of limitations of the underlying MOC library; in particular, non-convex polygons are not supported right now, and there are precision issue. We hope this will be rectified soon-ish when we base pgsphere's MOC operations on the CDS HEALPix library. Anyway, the result of this is plotted on the right of Fig. 3.

    Open Ends

    In case you have MOCs from the outside, you can also construct MOCs from literals, which happen to be the ASCII MOCs from the standard. This could look like this:

    SELECT TOP 1
      MOC('4/30-33 38 52 7/324-934') AS ar
    FROM tap_schema.tables
    

    For now, you cannot combine MOCs in CONTAINS and INTERSECTS expressions directly; this is mainly because in such an operation, the machine as to decide on the order of the MOC the other geometries are converted to (and computing the predicates between geometry and MOC directly is really painful). This means that if you have a local table with MOCs in a column cmoc that you want to compare against a polygon-valued column coverage in a remote table like this:

    SELECT db.* FROM
      lsw.plates AS db
      JOIN tap_upload.t6
    ON 1=CONTAINS(coverage, cmoc) -- fails!
    

    you will receive a rather scary message of the type “operator does not exist: spoly <@ smoc”. To fix it (until we've worked out how to reasonably let the computer do that), explicitly convert the polygon:

    SELECT db.* FROM
      lsw.plates AS db
      JOIN tap_upload.t6
    ON 1=CONTAINS(MOC(7, coverage), cmoc)
    

    (be stingy when choosing the order here – MOCs that already exist are fast, but making them at high order is expensive).

    Having said all that: what I've written here is bleeding-edge, and it is not standardised yet. I'd wager, though, that we will see MOCs in ADQL relatively soon, and that what we will see will not be too far from this experiment. Well: Some rough edges, I'd hope, will still be smoothed out.

    Getting This on Your Own DaCHS Installation

    If you are running a DaCHS installation, you can contribute to takeup (and if not, you can stop reading here). To do that, you need to upgrade to DaCHS's latest beta (anything newer than 2.1.4 will do) to have the ADQL extension, and, even more importantly, you need to install the postgresql-postgres package from our release repository (that's version 1.1.4 or newer; in a few weeks, getting it from Debian testing would work as well).

    You will probably not get that automatically, because if you followed our normal installation instructions, you will have a package called postgresql-11-pgsphere installed (apologies for this chaos; as ususal, every single step made sense). The upshot is that with our release repo added, sudo apt install postgresql-pgsphere should give you the new code.

    That's not quite enough, though, because you also need to acquaint the database with the new functions. This can only be done with database administrator privileges, which DaCHS by design does not possess. What DaCHS can do is figure out the commands to do that when it is called as dachs upgrade -e. Have a look at the output, and if you are satisfied it is about what to expect, just pipe it into psql as a superuser; in the default installation, dachsroot would be sufficiently privileged. That is:

    dachs upgrade -e | psql gavo   # as dachsroot
    

    If running:

    select top 1 gavo_mocunion(moc('1/3'), moc('2/9'))
    from tap_schema.tables
    

    through your TAP endpoint returns '1/3 2/9', then all is fine. For entertainment, you might also make sure that gavo_mocintersect(moc('1/3'), moc('2/13')) is 2/13 as expected, and that if you intersect with 2/3 you get back an empty string.

    So – let's bring MOCs to ADQL!

  • Histograms and Hidden Open Clusters

    image: reddish pattern

    Colour-coded histograms for distances of stars in the direction of some NGC open clusters -- one cluster per line, so you're looking a a couple of Gigabytes of data here. If you want this a bit more precise: Read the article and generate your own image.

    I have spent a bit of time last week polishing up what will (hopefully) be the definitive source of common ADQL User Defined Functions (UDFs) for IVOA review. What's a UDF, you ask? Well, it is an extension to ADQL where service operators can invent new functionality. If you have been following this blog for a while, you will probably remember the ivo_healpix_index function from our dereddening exercise (and some earlier postings): That was an UDF, too.

    This polishing work reminded me of a UDF I've wanted to blog about for a quite a while, available in DaCHS (and thus on our Heidelberg Data Center) since mid-2018: gavo_histogram. This, I claim, is a powerful tool for analyses over large amounts of data with rather moderate local means.

    For instance, consider this classic paper on the nature of NGC 2451: What if you were to look for more cases like this, i.e., (indulging in a bit of poetic liberty) open clusters hidden “behind” other open clusters?

    Somewhat more technically this would mean figuring out whether there are “interesting” patterns in the distance and proper motion histograms towards known open clusters. Now, retrieving the dozens of millions of stars that, say, Gaia, has in the direction of open clusters to just build histograms – making each row count for a lot less than one bit – simply is wasteful. This kind of counting and summing is much better done server-side.

    On the other hand, SQL's usual histogram maker, GROUP BY, is a bit unwieldy here, because you have lots of clusters, and you will not see anything if you munge all the histograms together. You could, of course, create a bin index from the distance and then group by this bin and the object name, somewhat like ...ROUND(r_est/20) as bin GROUP by name, bin – but that takes quite a bit of mangling before it can conveniently be used, in particular when you take independent distributions over multiple variables (“naive Bayesian”; but then it's the way to go if you want to capture dependencies between the variables).

    So, gavo_histogram to the rescue. Here's what the server-provided documentation has to say (if you use TOPCAT, you will find this in the ”Service” tab in the TAP windows' ”Use Service” tab):

    gavo_histogram(val REAL, lower REAL, upper REAL, nbins INTEGER) -> INTEGER[]
    
    The aggregate function returns a histogram of val with
    nbins+2 elements. Assuming 0-based arrays, result[0] contains
    the number of underflows (i.e., val<lower), result[nbins+1]
    the number of overflows. Elements 1..nbins are the counts in
    nbins bins of width (upper-lower)/nbins. Clients will have to
    convert back to physical units using some external communication,
    there currently is no (meta-) data as to what lower and upper was in
    the TAP response.
    

    This may sound a bit complicated, but the gist really is: type gavo_histogram(r_est, 0, 2000, 20) as hist, and you will get back an array with 20 bins, roughly 0..100, 100..200, and so on, and two extra bins for under- and overflows.

    Let's try this for our open cluster example. The obvious starting point is selecting the candidate clusters; we are only interested in famous clusters, so we take them from the NGC (if that's too boring for you: with TAP uploads you could take the clusters from Simbad, too), which conveniently sits in my data center as openngc.data:

    select name, raj2000, dej2000, maj_ax_deg
    from openngc.data
    where obj_type='OCl'
    

    Then, we need to add the stars in their rough directions. That's a classic crossmatch, and of course these days we use Gaia as the star catalogue:

    select name, source_id
    from openngc.data
    join gaia.dr2light
    on (
      1=contains(
        point(ra,dec),
        circle(raj2000, dej2000, maj_ax_deg)))
    where obj_type='OCl')
    

    This is now a table of cluster names and Gaia source ids of the candidate stars. To add distances, you could fiddle around with Gaia parallaxes, but because there is a 1/x involved deriving distances, the error model is complicated, and it is much easier and safer to adopt Bailer-Jones et al's pre-computed distances and join them in through source_id.

    And that distance estimation, r_est, is exactly what we want to take our histograms over – which means we have to group by name and use gavo_histogram as an aggregate function:

    with ocl as (
      select name, raj2000, dej2000, maj_ax_deg, source_id
      from openngc.data
      join gaia.dr2light
      on (
        1=contains(
          point(ra,dec),
          circle(raj2000, dej2000, maj_ax_deg)))
      where obj_type='OCl')
    
    select
      name,
      gavo_histogram(r_est, 0, 4000, 200) as hist
    from
      gdr2dist.main
      join ocl
      using (source_id)
    where r_est!='NaN'
    group by name
    

    That's it! This query will give you (admittedly somewhat raw, since we're ignoring the confidence intervals) histograms of the distances of stars in the direction of all NGC open clusters. Of course, it will run a while, as many millions of stars are processed, but TAP async mode easily takes care of that.

    Oh, one odd thing is left to discuss (ignore this paragraph if you don't know what I'm talking about): r_est!='NaN'. That's not quite ADQL but happens to do the isnan of normal programming languages at least when the backend is Postgres: It is true if computations failed and there is an actual NaN in the column. This is uncommon in SQL databases, and normal NULLs wouldn't hurt gavo_histogram. In our distance table, some NaNs slipped through, and they would poison our histograms. So, ADQL wizards probably should know that this is what you do for isnan, and that the usual isnan test val!=val doesn't work in SQL (or at least not with Postgres).

    So, fire up your TOPCAT and run this on the TAP server http://dc.g-vo.org/tap.

    You will get a table with 618 (or so) histograms. At this point, TOPCAT can't do a lot with them. So, let's emigrate to pyVO and save this table in a file ocl.vot

    My visualisation proposition would be: Let's substract a “background” from the histograms (I'm using splines to model that background) and then plot them row by row; multi-peaked rows in the resulting image would be suspicious.

    This is exactly what the programme below does, and the image for this article is a cutout of what the code produces. Set GALLERY = True to see how the histograms and background fits look like (hit 'q' to get to the next one).

    In the resulting image, any two yellow dots in one line are at least suspicious; I've spotted a few, but they are so consipicuous that others must have noticed. Or have they? If you'd like to check a few of them out, feel free to let me know – I think I have a few ideas how to pull some VO tricks to see if these things are real – and if they've been spotted before.

    So, here's the yellow spot programme:

    from astropy.table import Table
    import matplotlib.pyplot as plt
    import numpy
    from scipy.interpolate import UnivariateSpline
    
    GALLERY = False
    
    def substract_background(arr):
        x = range(len(arr))
        mean = sum(arr)/len(arr)
        arr = arr/mean
        background = UnivariateSpline(x, arr, s=100)
        cleaned = arr-background(x)
    
        if GALLERY:
            plt.plot(x, arr)
            plt.plot(x, background(x))
            plt.show()
    
        return cleaned
    
    
    def main():
        tab = Table.read("ocl.vot")
        hist = numpy.array([substract_background(r["hist"][1:-1])
          for r in tab])
        plt.matshow(hist, cmap='gist_heat')
        plt.show()
    
    
    if __name__=="__main__":
        main()
    
  • ADQL Traps #1: NULL

    NULL is a difficult concept. Not only in SQL

    NULL is a difficult concept. Not only in SQL

    I recently got embarrassed by ADQL NULLs, i.e., the magic value indicating that a value in a given column is missing. And since that's a common source of errors when writing ADQL queries, I'll take this as a cue for a blog post.

    The concrete background is fairly technical and registry-ish; suffice it to say that some data providers who implemented interfaces conforming to some standard didn't properly say so in their registry records. Back in RegTAP 1.0 (that's the standard that says how a client like TOPCAT talks to the VO Registry), I decided to work around that by fudging the pattern for how to discover those interfaces so they'd still be found.

    In RegTAP 1.1, which is now under review by the VO community, I wanted to do away with that workaround. But would that break anything? This question translates to “are there vs:ParamHTTP interfaces that don't have a role attribute of std”. Whatever “ParamHTTP” and “role attribute” actually mean, just appreciate that it looks like it might translate into SQL like:

    select * from rr.interface
    where
      intf_type='vr:paramhttp'
      and not intf_role='std'
    

    I ran that query, rejoiced because it didn't return anything, removed the workarund from the standard, and then was shot down when I read Mark's mail (politely) saying I'm wrong and there are services still requiring the workaround. As usual: If a query returns what you expect, be double careful.

    What went wrong? Well, NULL semantics. You see, in SQL NULL is never equal to anything, not even itself (it's like NaN in IEEE floats in that: try n = float('nan');print(n==n) in Python and look again if you're cool about it). It's also not unequal. Don't take my word for it. Try:

    select * from tap_schema.schemas where NULL=NULL
    

    and:

    select * from tap_schema.schemas where NULL!=NULL
    

    – you'll get empty results in both cases.

    What does that mean for science queries? Well, whenever there's NULLs in columns (and the only safe assumption for now is that they may hide in there; we should probably add nun-null as a column property in the tap schema and in VODataService some day), you need to be careful in particular with inverted logic.

    Here's an example: Suppose you want to investigate NGC objects brighter than 10 mag in B in one bin in everything else in another. The ones brighter are simple:

    select count(*) from openngc.data where mag_b<10
    

    (try it on the TAP server at http://dc.g-vo.org/tap, it's 383 in the current release). It becomes difficult for “the rest”. If you write:

    select count(*) from openngc.data where not mag_b<10
    

    or, equivalently:

    select count(*) from openngc.data where mag_b>=10
    

    you'll get (for the current release) 10887. However, the whole catalogue has 13954 entries, so there's 13954-10887-383=2684 rows missing. Your “rest” has missed everything for which mag_b isn't given. Sure enough:

    select count(*) from openngc.data where mag_b is null
    

    (and this is the only good way to compare against null) gives 2684.

    The right way to say “anything for which mag_b is not smaller than 10” thus is:

    select count(*) from openngc.data
    where
      not mag_b<10
      or mag_b is null
    

    Morale: Unless you're sure there are no missing values (i.e., NULLs) in a column you're looking at, think about what these mean to your research (or other) question: Should these rows just vanish? Then you usually don't need to do anything and the SQL semantics magically do the right thing (which is why things are defined as they are). If, however, the corresponding rows would mean something to your question, you need to be explicit, and you must have some condition involving IS NULL or IS NOT NULL.

    The trouble, of course, is that just knowing this still isn't enough. You need to remember it in the right moment. Or you'll share my fate of suffering some public embarrassement.

« Page 2 / 3 »