Posts with the Tag Spectra:

  • A Proposed Vector Extension for ADQL

    When I showed off my rendering of the Gaia DR 3 XP spectra a month ago, I promised I would later show how my proposal for a Vector extension to ADQL would enable quite a bit of interesting functionality on that table. Let me make good on this promise with a little project to find candidates for Wolf-Rayet stars, more specifically, WC stars. I give you that's a bit cheap because they have very distinctive spectral features, but then this is supposed to be a quick educational posting, not a science paper.

    Before I start, I probably should stress that in this context I am using the word “vector” like a computer guy would. We are talking about one-dimensional arrays here, not about the vectors the mathematicians have given us (as in “elements of vector spaces“).

    Getting Spectra for Wolf-Rayet Stars

    Let us first produce a list of Wolf-Rayet stars (of any denomination) using SIMBAD. So, start TOPCAT, open the TAP dialog and find the SIMBAD TAP server. Run:

    SELECT main_id, ra, dec
    FROM basic
    WHERE otype='WR*'
    

    there[1]. In the next step, we will need the Gaia DR3 source_ids for these objects, and so it would be nice to pull them immediately from Simbad; you could in principle do that by running:

    SELECT main_id, ra, dec, id
    FROM basic
      JOIN ident
      ON (oid=oidref)
    WHERE otype='WR*'
      AND id LIKE 'Gaia DR3%'
    

    – but for one, fiddling out the actual source_ids from the strings you get in the id column is a bit tedious, and then quite a few of these objects don't have Gaia ids yet: The first query returns 1548 at the moment, the second 696.

    If we had the source_ids, we could immediately join with the gdr3spec.spectra table at the GAVO DC TAP (http://dc.g-vo.org/tap). As I mentioned a month ago, this is a physical table just consisting of the source id and arrays of flux and flux errors. There is also gdr3spec.withpos that has positions and the spectra; but that's a view, and for the time being that means that the planner will quite likely get confused when positional constraints come into play[2]. The result would be queries running for half an hour when a few seconds would do just as well.

    On services already supporting ADQL 2.1, you can usually work around problems of this kind by re-writing your query to use CTEs (“WITH”), because these often work as planner barriers. In the present case, we first get source_ids for our Simbad objects in a CTE and then use these to join with our spectra table, like this:

    WITH wrids AS (
            SELECT source_id, main_id
            FROM gaia.edr3lite AS l
        JOIN tap_upload.t1 AS u
            ON (DISTANCE(l.ra, l.dec, u.ra, u.dec)<0.001))
    SELECT main_id, source_id, flux, flux_error
    FROM gdr3spec.spectra
    JOIN wrids USING (source_id)
    

    As usual, you will probably have to adapt the number in what is tap_upload.t1 here to the table index you have for your SIMBAD result.

    This yields 574 spectra at the moment, within a few seconds. Spectra for about a third of our collection of objects: I'd say that's quite impressive.

    Investigating the spectra

    The September post already discussed a few aspects of array plotting. In short: try the plane plot and an XYArray control. Modern TOPCATs (and for what I'm doing here it's wise to use something newer than 4.8-7) will automatically figure out suitable columns for the x and y axes (except it forgets to label the spectral coordinate with its unit, nm):
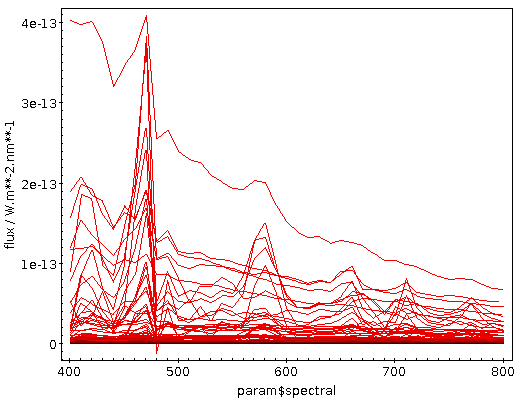
    Plot: lots of wiggly lines

    There's a quite a bit of crowding here; finding global characteristics perhaps works better when you switch the ordinate to logarithmic, use transparent shading (in the Form tab) and raise the opaque limit a bit. This could give you something like:
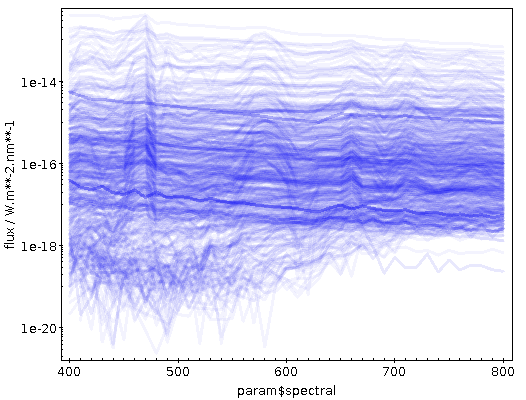
    Plot: hazy structures in blue

    You can see that at least quite a few objects have nice and strong emission lines, as I had hoped for when choosing WC stars for this example. What if we could pick them out to build a template spectrum? Well, let's try. With the new vector math in ADQL, the database can normalise the spectra and compute a few statistics on them.

    But first: In order to get rid of the source_id-computing CTE above, let me obtain the source_ids I want to work with once and for all, as in:

    SELECT source_id, main_id
    FROM gaia.edr3lite AS l
      JOIN tap_upload.t1 AS u
            ON (DISTANCE(l.ra, l.dec, u.ra, u.dec)<0.001)
    

    Memorise the Table List index of the result. With that, you can directly work with the gdr3spec.spectra table and experiment a bit; for me, the index was 10, and hence I use tap_uploads.t10 below.

    Computing some statistics

    The Gaia XP spectra are flux calibrated, and hence I will have to normalise them if I want to compare them. Ignoring all errors and thus in particular the fact that some (few) components are negative, this normalisation is harmless: We just divide by the sum of all vector components. The net result is that, were our spectra continuous, the integral over them would be one. And let's then use the standard deviation and the value of the 19th array element as metrics:

    WITH normalised AS (
    SELECT source_id, main_id,
            flux/arr_sum(flux) as nflux, flux
    FROM gdr3spec.spectra
    JOIN tap_upload.t10
    USING (source_id))
    SELECT
      source_id, main_id,
      flux, nflux,
      arr_avg(nflux*nflux)-POWER(arr_avg(nflux),2) AS sd,
      nflux[19] as em
    FROM normalised
    

    You can see quite a bit of the vector extension here:

    • arr_sum and arr_avg: These work as the aggregate functions in SQL do, just not on tuples but on the components of the vectors.
    • Multiplication of vectors is element-wise, so nflux*nflux computes a vector of the squares of the components of nflux. That's also true for all other basic arithmetic operators. If you know numpy: same thing.
    • You fetch individual elements in the [] notation you probably know from Python or C. Contrary to Python and C, common SQL implementations count indexes from 1 by default, and we are keeping that here (for now). Fortran lovers rejoice!

    Why did I use nflux[19]? Well, there is a reasonably strong emission feature in many spectra at about 580 nm (it's three-time ionised carbon, or C IV in the rotten notation I usually apologise for when talking to non-astronomers), which is, as experts tell me (thanks, Andreas!), rather characteristic for the WC stars that I'm after (whereas the even stronger feature on the left, around 470 nm, can also be Helium).

    If you inspect the spectral coordinate that TOPCAT has on the abscissa (it's a param, so you'll have to go to ViewsTable Parameters to see it), you will see that each spectral bin is 10 nm wide. So, I will hopefully hit the 580 nm feature when fetching the 19th element of the spectral vector.

    If you plot em versus the sd obtained like that, you will see two reasonably distinct groups, where the ascending arm has relatively strong emission around 580 nm and the descending arm does not. I have used the Blob subset feature to select the upper arm into a subset ”upper” that is blue in the following plot. If you click around in the em-sd plot and show the Activated subset in an array plot, you can see things like:
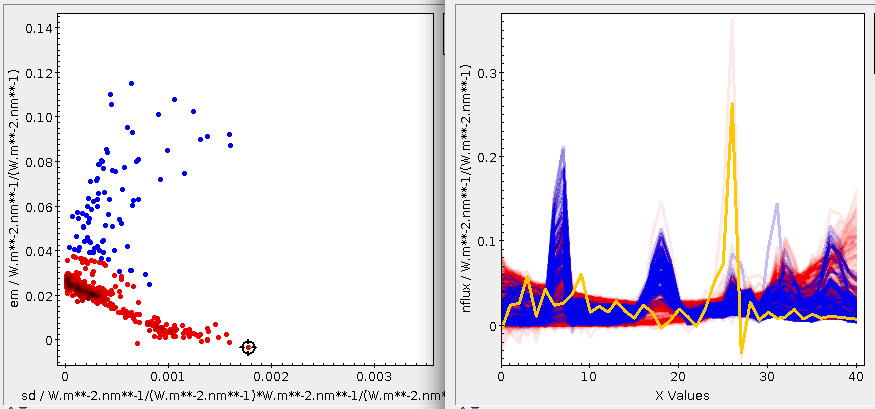
    Screenshot: scatterplot and stacked spectra next to each other

    The activated spectrum (shown here in yellow) has a strong Hα but basically no C IV – and it's safely outside of our carbon subset. Click around a bit on the ascending arm, and you will see that all these spectra have a bump around array element 18 (in TOPCAT's count, which starts at 0).

    Computing a Template on the Server Side

    Whatever the subset of stars that we would like to use to define our group of interest, we would now like to create a template spectrum from them. A plausible way to do that is to sum them all up – that has the nice side effect that stronger sources (which hopefully are less noisy) have a larger weight.

    To compute the template, in the Views → Column Info for the sd/em table, unselect all columns but source_id (that way, you only upload what you absolutely must), and in the main window, select the upper subset in the Row Subset combo box. That way, only the rows in that subset will get uploaded in the following query:

    SELECT summed/arr_sum(summed) AS tpl
    FROM (
      SELECT SUM(flux) AS summed
      FROM gdr3spec.spectra
      JOIN tap_upload.t19
      USING (source_id)) AS q
    

    Again, you will have to adapt the t19 to where your manipulated sd/em table is. If you get an “ambiguous column flux” error (or so) here, you forgot to unselect all columns but source_id in the columns window.

    It pays to briefly appreciate what happens here: The SELECT SUM(flux) is an aggregate function over arrays, meaning that all the arrays are being summed over component-wise. Against that, the sum in summed/arr_sum(summed) is summing within the array. If it helps you, you could imagine having all the arrays in the table stacked. Then, SUM(arr) produces the vertical margin sum, and array_sum(arr) procudes the horizontal margin sum.

    Well, here's the template I got in this way:
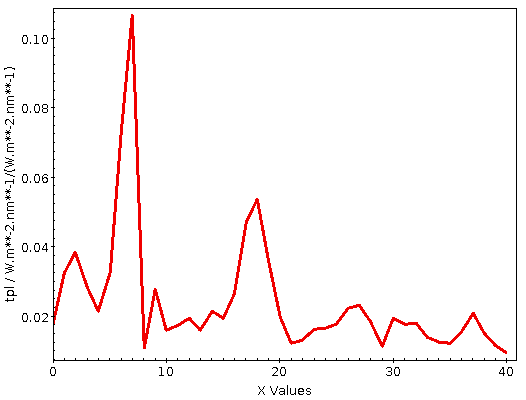
    Plot: a single wiggly line

    I give you that in this particular case, you could easily have done the computation on the client side, because you already had the spectra in your table. But the technique also works when you don't, and it will scale to millions of arrays (although you will have to carefully think about numerics when doing such enormous sums).

    Also – I cannot lie – I simply had to have a pretext for showing you aggregate functions over arrays.

    Finding Similar Objects

    Now that we have the template, can we find objects that have similar properties? Sure: We upload the array and compute some metric, perhaps the (squared) euclidian distances to normalised spectra. If the template is in TOPCAT's table 25, you can write:

    SELECT TOP 200000
      source_id,
      arr_sum(
        arr_map(
          power(x,2),tpl-flux/arr_sum(flux))) AS dist2,
      arr_sum(flux_error/flux) AS errs
    FROM gdr3spec.spectra, tap_upload.t25
    

    This will compute the distances between (conceptually randomly drawn) 200000 spectra and your template. I am also requesting the sum of the (relative) flux errors as a measure of how likely it is that wild wiggles actually are just artefacts.

    There is one array-related feature in that query I have not yet mentioned: arr_map. This applies an expression to all components to a vector, pretty much like python's map function, and my attempt to have some (perhaps somewhat lame) substitute for numpy's ufunctions.

    I am rather sure we really need something like this. SQL has no notion of defining functions in queries. That is usually welcome, as otherwise it would quicky become Turing-complete, which would be bad for what it is designed to do. Here, however, that is a problem, because we do not have a clean way to write the expression be be computed for each component. For now, I have decreed that the first argument of map is an expression over a formal x. This is ugly not only because it will be confusing when there's an actual x in a table or query. I suspect with a bit more thought and creativity, one can find a better solution that still does not require a re-write of half the SQL grammar. But then let's see – perhaps this makeshift hack proves to be less troublesome than I expect.

    Note that on my server, you will only get back 20000 matches by default; you would have to adapt Max Rows to actually retrieve 200'000, and then you also must switch to Asynchronous mode. This will then actually take a non-trivial amount of CPU and disk I/O; going through the entire set of 2e8 rows will be a matter of hours or so. Hence, I'm grateful if you do all-sky scans only after having tested your queries on much smaller subsets.

    I've done this for 500'000 rows (which took a few minutes), which might bring up a few C IV-strong WR stars (these beasts are rare, you know). The result in the dist2/errs plane is (logplot zoomed a bit):
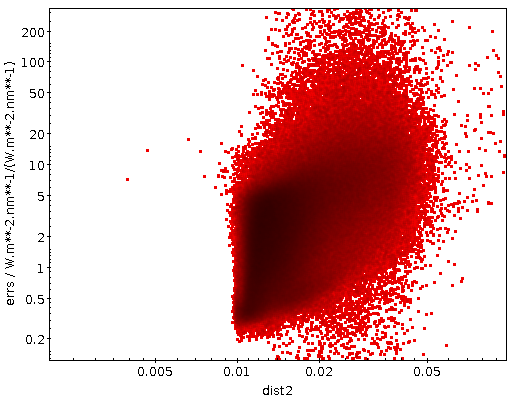
    Plot: a gigantic point cloud with a few outliers.

    Well: at least there are a few promising cases. Which would conclude this little demo for the ADQL vector proposal. Looking at what we have found here is another story.

    Still, I could not resist having another look at what my box has found there. There is a rather clear cut in the plot at perhaps 0.009, and thus I created a subset interesting consisting of objects for which dist2<0.009 (which is 18 objects for me) and did the trick above, only uploading this interesting subset with only the source_id column to resolve to Gaia DR3 (lite) rows:

    SELECT *
    FROM gaia.dr3lite
    JOIN tap_upload.t33
    USING (source_id)
    

    And then I wondered whether any of these were known to SIMBAD and switched to their TAP service:

    SELECT
      tc.*, otype
    FROM basic AS db
     RIGHT OUTER JOIN TAP_UPLOAD.t34 AS tc
     ON 1=CONTAINS(POINT('ICRS', db.ra, db.dec),
                   CIRCLE('ICRS', tc.ra, tc.dec, 1./3600.))
    

    Note the use of RIGHT OUTER JOIN to ensure we won't lose any matches on the way; if this weren't such a small table, you'd be better off just uploading the positions and then doing a local match to recover the rest of the table, by the way.

    As to what's coming back: Well, a bunch of white dwarf candidates, a “blue“ star, a few objects SIMBAD knows as quasars (that at least makes sense, because it's rather likely that some of them have lines redshifted into my C IV window), and a few unclassified objects. Whether SIMBAD is wrong on at least some of them, whether the positional crossmatch fetched unrelated objects, or whether I got it all wrong I will not decide here. Let me give you my candidates as a VOTable, though.

    You now know what you have to do to add nice, if low-resolution, spectra to them.

    Slices?

    A notable absence from the current vector extension is slicing. I think we should have it – in this example, this would be really useful when summing different spectral regions without having to write long sums (“synthetic broadband photometry“).

    I have not put it in yet mainly because I am not sure if Python-like syntax (nflux[4:7]) is a good idea when we have 1-based arrays. Also: Do we want to keep the upper index out? That's certainly the right thing for Python (where you want a[:3]+a[3:] == a), but is it here? Speaking of which: Should we require support of half-open slices? Should we rather have a function arr_slice? With what arguments?

    I'd be curious about other peoples' thoughts on slicing.

    [1]

    In case you wonder how I came up with the WR*: You can simply run something like:

    SELECT otype, label
    FROM otypedef
    WHERE description LIKE '%Wolf%'
    

    Once Simbad upgrades to ADQL 2.1, you probably want to replace the LIKE with ILIKE for robustness.

    [2]For the incurably curious, you can learn more about the underlying problem at https://github.com/segasai/q3c/issues/30.
  • Gaia DR3 XP Spectra: All Sampled

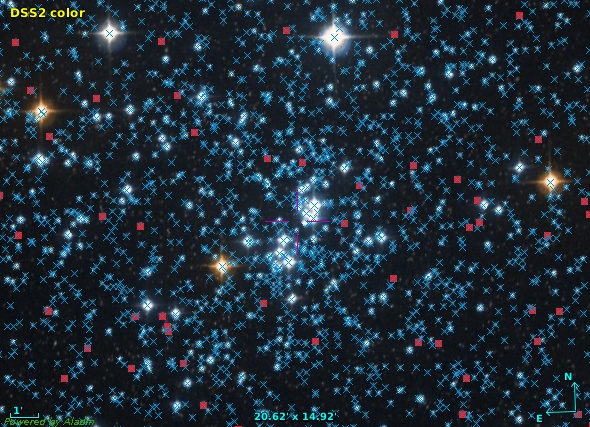
    Lots of blue crosses and a few red squares plotted over a sky photograph of a star cluster

    Around this time of the year on the northern hemisphere, you can spot the h and χ Persei double star cluster with the naked eye. One part of it, NGC 884 is shown here with LAMOST DR6 low resolution spectra (red squares) and Gaia DR3 XP spectra (blue crosses) overplotted. Given that LAMOST has already been one of the largest collections of spectra on the planet, you can see that there is really a lot of those XP spectra.

    When Gaia DR3 was released in June, I was somewhat disappointed when I realised what it is that they delivered as the BP/RP (or XP for short) spectra. You see, I had expected to see something rather similar to what I have in DFBS: structurally, arrays of a few dozen spectral points, mapping wavelengths to some sort of measure of the flux.

    What really came were, mainly, “continuous spectra“, that is coefficients of Gauss-Hermite polynomials. You can fetch them from the gaiadr3.xp_continuous_mean_spectrum table at the ARI-Gaia TAP service; the blue part of the spectrum of the star DR3 4295806720 looks like this in there:

    102.93398893929992, -12.336921213781045, -2.668856168170544, -0.12631176306793765, -0.9347021092539146, 0.05636787290132809, [...]

    No common spectral client can plot this. The Gaia DPAC has helpfully provided a Python library called GaiaXPy to turn these into “proper” spectra. Shortly after the data release, my plan has thus been to turn all these spectra into their “sampled” form using GaiaXPy and then re-publish them, both through SSAP for ad-hoc discovery and through TAP for (potentially) global analysis.

    Alas, for objects too faint to make it into DR3's xp_sampled_mean_spectrum table (that's 35 million spectra already turned to wavelength-flux pairs by DPAC), the spectra generated in this way looked fairly awful, with lots of very artificial-looking wiggles (“ringing”, if you will). After a bit of deliberation, I realised that when the errors are given on the Hermite coefficients, once you compute the samples, these errors will be liberally distributed among the output samples. In other words, the error on the samples will be grossly correlated over arbitrary distances; at least I am fairly helpless when trying to separate signal from artefact in these beasts.

    Bummer. Well, fortunately, Rene Andrae from “up the mountain” (i.e., the MPI for Astronomy) has worked out a reasonably elegant way to get more conventional spectra understandable to mere humans. Basically, you compute n distinct “realisations” of the error model given by the table of the continuous spectra and average over them. The more samples you take, the less correlated your spectral points and their errors will be and the less confusing the signal will be. The service docs for gaia/s3 give the math.

    Doing this on more than 200 million spectra is quite an effort, though, and so after some experimentation I decided to settle on 10 realisations per spectrum and have relatively wide bins (10 nm) over just the optical part of the spectrum (400 through 800 nm). The BP and RP bandpaths are a bit wider, and there is probably signal blotted out by the wide bins; I will probably be addressing this for DR4, except if these spectra become the smash hit they deserve to be.

    The result of this procedure is now available through an SSAP service that should show up in the VO Registry by the time the first of you read this; the Aladin image above gives you an impression of the density of results here – and don't forget: the spectra with the blue crosses are all reasonably well flux-calibrated.

    The data is also available on the TAP service http://dc.g-vo.org/tap, which opens up many interesting possibilities. Let me mention two here.

    Comparison with LAMOST

    I was rather nervous whether what I had done resulted in anything that bore even a fleeting resemblance to reality, and so about the first thing I tried was to compare my new data with what LAMOST has.

    That is a nice exercise for TAP and ADQL. Let's first match spectra from the two surveys, which luckily are on the same server, saving us some cross-server uploads. I am selecting a minimum of data, just the position and the two access URLs, and I let DaCHS' MAXREC kick in so I'm just retrieving 20000 of the millions of result records:

    SELECT a.ssa_location, a.accref, b.accref
    FROM
      gdr3spec.ssameta AS a
      JOIN lamost6.ssa_lrs AS b
      ON DISTANCE(a.ssa_location, b.ssa_location)<0.001
    

    (this is using the DISTANCE(.,.)<radius idiom that we will be migrating towards in ADQL 2.1 instead of the dreaded 1=CONTAINS(POINT, CIRCLE) thing everyone has loathed in ADQL 2.0).

    Using the nifty activation actions, you can now tell TOPCAT to open the two spectra next to each other when you click on a row or a point in a sky plot. To reproduce,

    1. Make a sky plot. TOPCAT doesn't yet pick up the POINT in ssa_location, so you have to configure the Lon and Lat fields yourself to ssa_location[0] and ssa_location[1].
    2. Open the activation actions, either from the button bar or from the Views menu.
    3. In there, select Plot Table, make sure it says accref in Table Location and then check Plot Table in the Actions pane. When you now click on a point in the sky plot, you should see a spectrum pop up, except it is plotted with dots, which most people consider inappropriate for spectra. Use the Form tab in the plot window to style it a bit more spectrum-like (I recommend looking into Line and XYError).
    4. But how do you now add the LAMOST plot? I don't think TOPCAT's activation actions let you plot right into the plane plot you just configured. But you can add a second Plot Table action from the Actions menu in the window with the activation actions. As before, configure this new item, except this one needs to plot accref_ (which is what DaCHS has called the access reference for LAMOST to keep the names unique).
    5. As for Gaia, configure to plot to look good as a spectrum. In order to make the two spectra optically comparable, under Axes set the range to 4000 to 8000 Angstrom manually here.

    You can now click on points in your sky plot and, after a second or so, see the corresponding spectra next to each other (if you place the two plot windows that way).

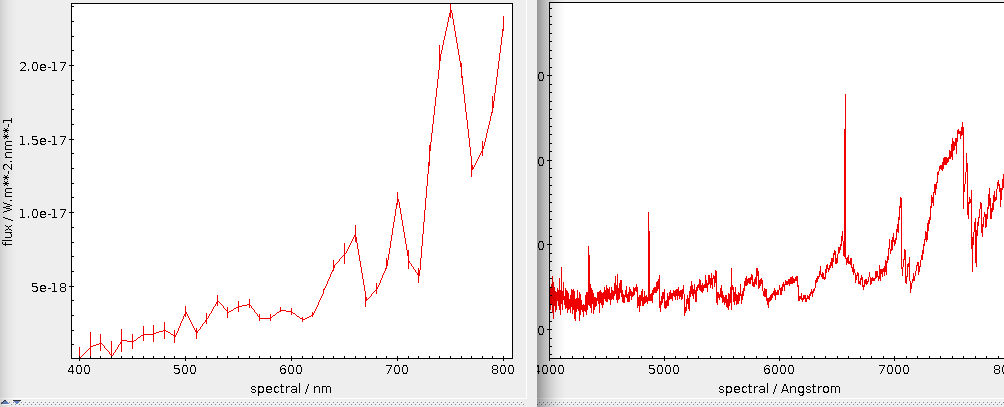
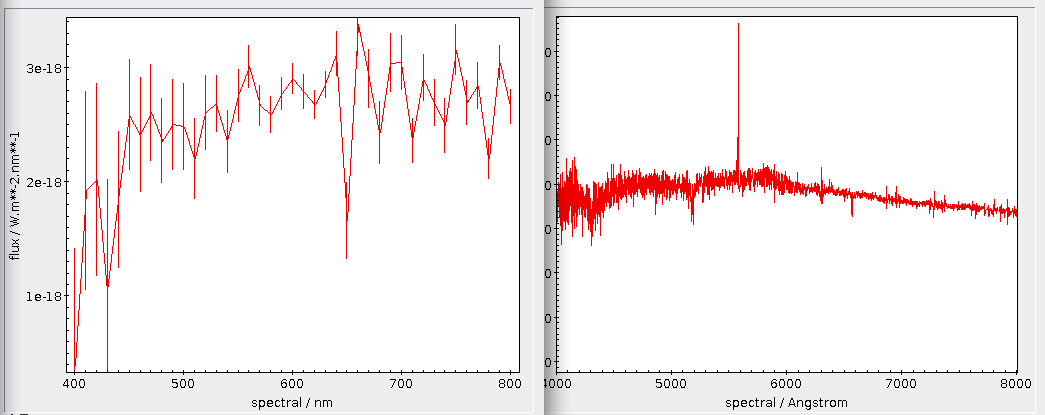
    If you try this, you will (hopefully) see that major features of spectra are nicely reproduced, such as with these, I guess, molecular bands:

    Two line plots next to each other, the right one showing more features.  the left one roughly follows the major wiggles, though.

    As you probably have guessed, the extremely low-resolution Gaia XP spectrum is left, LAMOST's (somewhat higher-resolution) low-resolution spectrum is right:

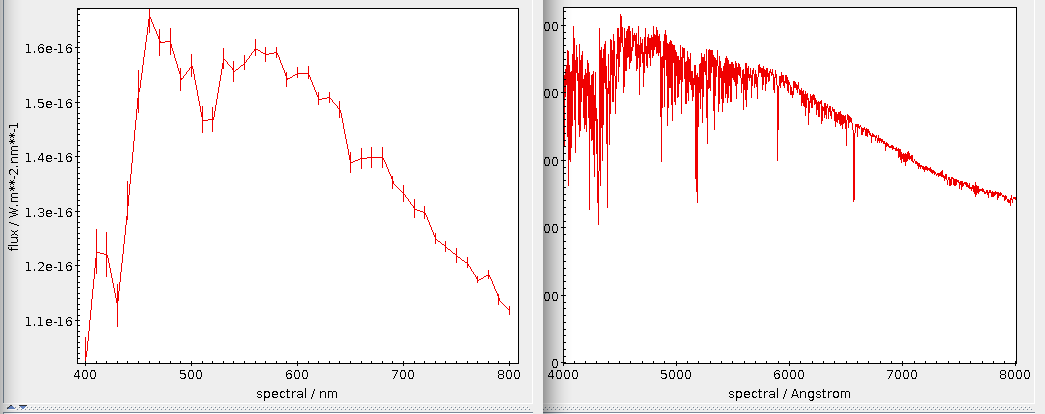
    This also works with absorption in the blue, as in this example:

    Two line plots next to each other, the right one showing a lot of relatively sharp absoprtion lines, which the left one does not have.  A few major bumps are present in both, and the general shape conincides nicely, expect perhaps at the blue edge.

    In case of doubt, I have to say I'd probably trust Gaia's calibration around 400 nm better than LAMOST's. But that's mere guesswork.

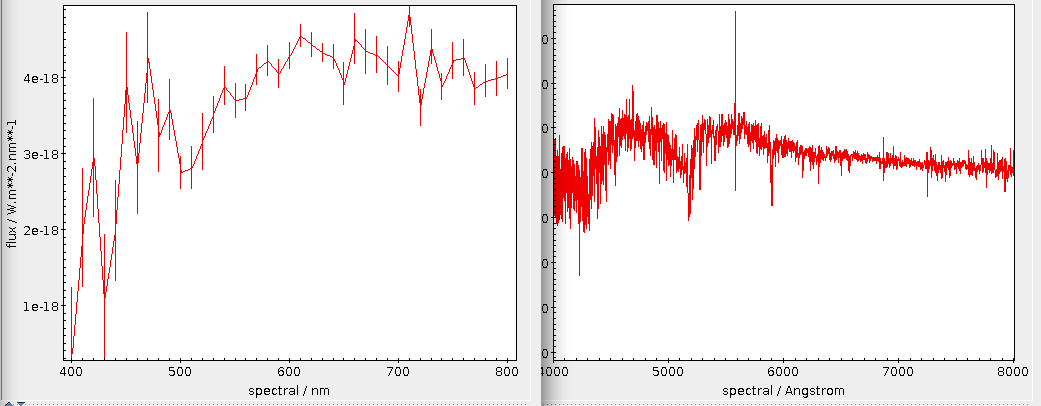
    For fainter objects, you will see remnants of the systematic wiggles from the Hermite polynomials:

    Two line plots next to each other.  Both are relatively noisy, in particular on the blue edge.  The left one also seems to have a rather regular oscillation at the blue edge.

    Anyway, if you keep an eye on the errors, you can probably even work with spectra from the fainter objects:

    Two line plots next to each other.  The left one has fairly strong ringing which is not present in the right one, but it mainly stays within the error bars.  The total flux of this star is at least a factor of 10 less than for the prettier examples above.

    Mass Retrieval of Spectra

    One nice thing about the short spectra is that you can fetch many of them in one go and in very little time. For instance, to retrieve particularly red objects from the Gaia catalogue of Nearby Stars (also on the GAVO server) with spectra, say:

    SELECT
      source_id, ra, dec, parallax, phot_g_mean_mag,
      phot_bp_mean_mag, phot_rp_mean_mag, ruwe, adoptedrv,
      flux, flux_error
    FROM gcns.main
    JOIN gdr3spec.spectra
    USING (source_id)
    WHERE phot_rp_mean_mag<phot_bp_mean_mag-4
    

    [in case you wonder how I quickly got the column names enumerated here: do control-clicks into the Columns pane in TOCPAT's TAP window and then use the Cols button]. For when you do not have Gaia DR3 source_id-s in your source table, there is also gdr3spec.withpos against which you can do more conventional positional crossmatches.

    Within a few seconds, you can retrieve more than 4000 spectra in this way. You can now do whatever analysis you want on these spectra. Or, well, just plot them. The following procedure for that later task uses TOPCAT features only available in the next release, due before mid-October[1].

    First, make a colour-magnitude diagram (CMD) from this table as usual (e.g., BP-RP vs G). Then, open another plane plot and

    1. LayersAdd XYArray Control
    2. Configure the XYArray to plot from the table you just fetched, have nothing in X Values[2] and flux in Y Values.
    3. Under Axes, configure Y Log in order to better show the 4253 spectra at one time.
    4. Throw away or at least uncheck all other layers in the plot.
    5. In order to let TOPCAT highlight the spectrum of the activated source, in the Subsets pane check the Activated subset (that's the bleeding-edge functionality you will not have in older TOPCATs) and give it a sufficiently bright colour.

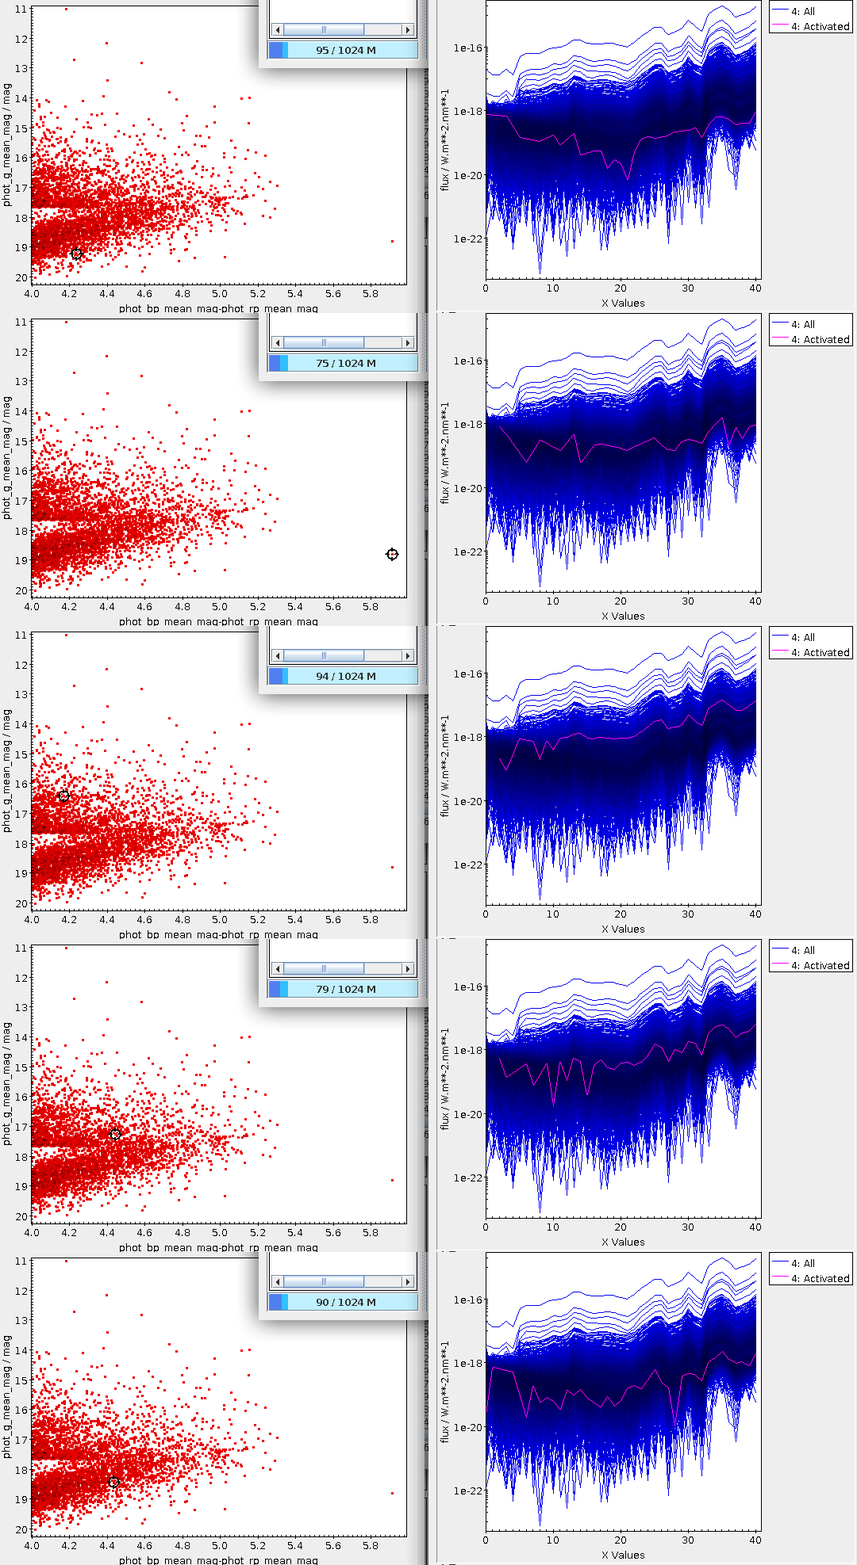
    With that, you can now click around in your CMD and immediately see that source's spectrum in the context of all the others, like this:

    An animation of someone selecting various points in a CMD and have simulataneous spectra plotted.

    These spectra have also inspired me to design and implement a vector extension for ADQL, which lets you do even more interesting things with these spectra. More on this… soon.

    [1]The Activated subset is only available in TOPCAT versions later than 4.8-7 (released in October 2022).
    [2]These should be the spectral points; DaCHS does not deliver them with this query because I am a coward. I think I will find my courage relatively soon and then fix this. Once that has happened, you can select param$spectral as X values. [Update: Mark Taylor remarks that by writing sequence(41, 400, 10) in bleeding-edge TOPCATs and add(multiply(10,sequence(41)),400) before that, you can add a proper spectral axis until then]
  • Spectral Units in ADQL

    math formulae.

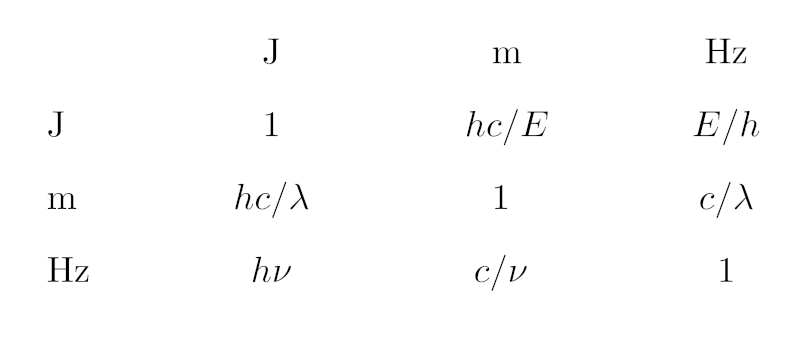
    In case you find the piece of Python given below too hard to read: It's just this table of conversion expressions between the different SI units we are dealing with here.

    Astronomers these days work all along the electromagnetic spectrum (and beyond, of course). Depending on where they observe, they will have very different instrumentation, and hence some see their messengers very naturally as waves, others quite as naturally as particles, others just as electrons flowing out of a CCD that is sitting behind a filter.

    In consequence, when people say where in the spectrum they are, they use very different notions. A radio astronomer will say “I'm observing at 21 cm” or “at 50 GHz“. There's an entire field named after a wavelength, “submillimeter“, and blueward of that people give their bands in micrometers. Optical astronomers can't be cured of their Ångström habit. Going still more high-energy, after an island of nanometers in the UV you end up in the realm of keV in X-ray, and then MeV, GeV, TeV and even EeV.

    However, there is just one VO (or at least that's where we want to go). Historically, the VO has had a slant towards optical astronomy, which gives us the legacy of having wavelengths in far too many places, including Obscore. Retrospectively, this was an unfortunate choice not only because it makes us look optical bigots, but in particular because in contrast to energy and, by ν = E/h, frequency, messenger wavelength depends on the medium you work in, and I shudder to think how many wavelengths in my data center actually are air wavelengths rather than vacuum wavelengths. Also, as you go beyond photons, energy really is the only thing that reasonably characterises all messengers alike (well, even that still isn't quite settled for gravitational waves as long as we're not done with a quantum theory of gravitation).

    Well – the wavelength milk is spilled. Still, the VO has been boldly expanding its reach beyond the optical and infrared windows (recently, with neutrinos and gravitational waves, not to mention EPN-TAP's in-situ measurements in the solar system, even beyond the electromagnetic spectrum). Which means we will have to accomodate the various customs regarding spectral units described above. Where there are “thick” user interfaces, these can care about that. For instance, my datalink XSLT and javascript lets people constrain spectral cutouts (along BAND) in a variety of units (Example).

    But what if the UI is as shallow as it is in ADQL, where you deal with whatever is in the underlying database tables? This has come up again at last week's EuroVO Technology Forum in virtual Strasbourg in the context of making Obscore more attractive to radio astronomers. And thus I've sat down and taught DaCHS a new user defined function to address just that.

    Up front: When you read this in 2022 or beyond and everything has panned out, the function might be called ivo_specconv already, and perhaps the arguments have changed slightly. I hope I'll remember to update this post accordingly. If not, please poke me to do so.

    The function I'm proposing is, mainly, gavo_specconv(expr, target_unit). All it does is convert the SQL expression expr to the (spectral) target_unit if it knows how to do that (i.e., if the expression's unit and the target unit are spectral units properly written in VOUnit) and raise an error otherwise.

    So, you can now post:

    SELECT TOP 5 gavo_specconv(em_min, 'GHz') AS nu
    FROM ivoa.obscore
    WHERE gavo_specconv((em_min+em_max)/2, 'GHz')
        BETWEEN 1 AND 2
      AND obs_collection='VLBA LH sources'
    

    to the TAP service at http://dc.g-vo.org/tap. You will get your result in GHz, and you write your constraint in GHz, too. Oh, and see below on the ugly constraint on obs_collection.

    Similarly, an X-ray astronomer would say, perhaps:

    SELECT TOP 5 access_url, gavo_specconv(em_min, 'keV') AS energy
    FROM ivoa.obscore
    WHERE gavo_specconv((em_min+em_max)/2, 'keV')
      BETWEEN 0.5 AND 2
      AND obs_collection='RASS'
    

    This works because the ADQL translator can figure out the unit of its first argument. But, perhaps regrettably, ADQL has no notion of literals with units, and so there is no way to meaningfully say the equivalent of gavo_specconv(656, 'Hz') to get Hα in Hz, and you will receive a (hopefully helpful) error message if you try that.

    However, this functionality is highly desirable not the least because the queries above are fairly inefficient. That's why I added the funny constraints on the collection: without them, the queries will take perhaps half a minute and thus require async operation on my box.

    The (fundamental) reason for that is that postgres is not smart enough to work out it could be using an index on em_min and em_max if it sees something like nu between 3e8/em_min and 3e7/em_max by re-writing the constraint into 3e8/nu between em_min and em_max (and think really hard about whether this is equivalent in the presence of NULLs). To be sure, I will not teach that to my translation layer either. Not using indexes, however, is a recipe for slow queries when the obscore table you query has about 85 million rows (hi there in 2050: yes, that was a sizable table in our day).

    To let users fix what's too hard for postgres (or, for that matter, the translation engine when it cannot figure out units), there is a second form of gavo_specconv that takes a third argument: gavo_specconv(expr, unit_of_expr, target_unit). With that, you can write queries like:

    SELECT TOP 5 gavo_specconv(em_min, 'Angstrom') AS nu
    FROM ivoa.obscore
    WHERE gavo_specconv(5000, 'Angstrom', 'm')
      BETWEEN em_min AND em_max
    

    and hope the planner will use indexes. Full disclosure: Right now, I don't have indexes on the spectral limits of all tables contributing to my obscore table, so this particular query only looks fast because it's easy to find five datasets covering 500 nm – but that's an oversight I'll fix soon.

    Of course, to make this functionality useful in practice, it needs to be available on all obscore services (say) – only then can people run all-VO obscore searches without the optical bias. The next step (before Bambi-eyeing the TAP implementors) therefore would be to get it into the catalogue of ADQL user defined functions.

    For this, one would need to specify a bit more carefully what units must minimally be supported. In DaCHS, I have built this on a full implementation of VOUnits, which means you can query using attoparsecs of wavelength and get your result in dekaerg (which is a microjoule: 1 daerg = 1 uJ in VOUnits – don't you just love this?):

    SELECT gavo_specconv(
      (spectral_start+spectral_end)/2, 'daerg')
      AS energy
    FROM rr.stc_spectral
    WHERE gavo_specconv(0.0002, 'apc', 'J')
      BETWEEN spectral_start AND spectral_end
    

    (stop computing: an attoparsec is about 3 cm). This, incidentally, queries the draft RegTAP extension for the VODataService 1.2 coverage in space, time, and spectrum, which is another reason I'm proposing this function: I'm not quite sure how well my rationale that using Joules of energy is equally inconvenient for all communities will be generally received. The real rationale – that Joule is the SI unit for energy – I don't dare bring forward in the first place.

    Playing with wavelengths in AU (you can do that, too; note, though, that VOUnit forbids prefixes on AU, so don't even try mAU) is perhaps entertaining in a slightly twisted way, but admittedly poses a bit of a challenge in implementation when one does not have full VOUnits available. I'm currently thinking that m, nm, Angstrom, MHz, GHz, keV and MeV (ach! No Joule! But no erg, either!) plus whatever spectral units are in use in the local tables would about cover our use cases. But I'd be curious what other people think.

    Since I found the implementation of this a bit more challenging than I had at first expected, let me say a few words on how the underlying code works; I guess you can stop reading here unless you are planning to implement something like this.

    The fundamental trouble is that spectral conversions are non-linear. That means that what I do for ADQL's IN_UNIT – just compute a conversion factor and then multiply that to whatever expression is in its first argument – will not work. Instead, one has to write a new expression. And building these expressions becomes involved because there are thousands of possible combinations of input and output units.

    What I ended up doing is adopting standard (i.e., SI) units for energy (J), wavelength (m), and frequency (Hz) as common bases, and then first convert the source and target units to the applicable standard unit. This entails trying to convert each input unit to each standard unit until a conversion actually works, which in DaCHS' Python looks like this:

    def toStdUnit(fromUnit):
        for stdUnit in ["J", "Hz", "m"]:
            try:
                 factor = base.computeConversionFactor(
                     fromUnit, stdUnit)
            except base.IncompatibleUnits:
                continue
            return stdUnit, factor
    
        raise common.UfuncError(
            f"specconv: {fromUnit} is not a spectral unit understood here")
    

    The VOUnits code is hidden away in base.computeConversionFactor, which raises an IncompatibleUnits when a conversion is impossible; hence, in the end, as a by-product this function also determines what kind of spectral value (energy, frequency, or wavelength) I am dealing with.

    That accomplished, all I need to do is look up the conversions between the basic units, which can be done in a single dictionary mapping pairs of standard units to the conversion expression templates. I have not tried to make these templates particularly pretty, but if you squint, you can still, I hope, figure out this is actually what the opening image shows:

    SPEC_CONVERSION = {
        ("J", "m"): "h*c/(({expr})*{f})",
        ("J", "Hz"): "({expr})*{f}/h",
        ("J", "J"): "({expr})*{f}",
        ("Hz", "m"): "c/({expr})/{f}",
        ("Hz", "Hz"): "{f}*({expr})",
        ("Hz", "J"): "h*{f}*({expr})",
        ("m", "m"): "{f}*({expr})",
        ("m", "Hz"): "c/({expr})/{f}",
        ("m", "J"): "h*c/({expr})/{f}",}
    

    expr is (conceptually) replaced by the first argument of the UDF, and f is the conversion factor between the input unit and the unit expr is in. Note that thankfully, no additive operators are involved and thus all this is numerically well-conditioned. Hence, I can afford not attempting to simplify any of the expressions involved.

    The rest is essentially book-keeping, where I'm using the ADQL parser to turn the expression into a tree fragment and then fiddling in the tree fragment for expr into that. The result then replaces the UDF function call in the syntax tree. You can review all this in context in DaCHS' ufunctions.py, starting at the definition of toStdUnit.

    Sure: this is no Turing award material. But perhaps these notes are useful when people want to put this kind of thing into their ADQL engines. Which I'd consider a Really Good Thing™.

  • LAMOST5 meets Datalink

    One of the busiest spectral survey instruments operated right now is the Large Sky Area Multi-Object Fiber Spectrograph Telescope (LAMOST). And its data in the VO, more or less: DR2 and DR3 have been brought into the VO by our Czech colleagues, but since they currently lack resources to update their services to the latest releases, they have kindly given me their DaCHS resource descriptor, and so I had a head start for publishing DR5 in Heidelberg.

    With some minor updates, here it is now: Over nine million medium-resolution spectra covering large parts of the northen sky – the spatial coverage is like this:

    Coverage Healpix map

    There's lots of fun to be had with this; of course, there's an SSA service, so when you point Aladin or Splat at some part of the covered sky and look for spectra, chances are you'll see LAMOST spectra, and when working on some of our tutorials (this one, for example), it happened that LAMOST actually had what I was looking for when writing them.

    But I'd like to use the opportunity to mention two other modes of accessing the data.

    Stacked spectra

    Tablesample and TOPCAT's Plot Table activation action

    Say you'd like to look at spectra of M stars and would like to have some sample from across the sky, fire up TOPCAT, point its TAP client the GAVO DC TAP service (http://dc.g-vo.org/tap) and run something like:

    select
      ssa_pubDID, accref, raj2000, dej2000, ssa_targsubclass
    from lamost5.data tablesample(1)
    where
      ssa_targsubclass like 'M%'
    

    This is using the TABLESAMPLE modifier in the from clause, which isn't standard ADQL yet. As mentioned in the DaCHS 1.4 announcement, DaCHS has a prototype implementation of what's been discussed on the IVOA's DAL mailing list: pick a part of a table rather than the full one. It takes a percentage as an argument, and tells the server to choose about this percentage of the table's records using a reasonable and fast heuristic. Note that this won't give you perfect statistical sampling, but if it's not “good enough” for some purpose, I'd like to learn about that purpose.

    Drawing a proper statistical sample, on the other hand, would take minutes on the GAVO database server – with tablesample, I had the roughly 6000 spectra the above query returns essentially instantaneously, and from eyeballing a sky plot of them, I'd say their distribution is close enough to that of the full DR5. So: tablesample is your friend.

    For a quick look at the spectra themselves, in TOPCAT click Views/Activation Actions, check “Plot Table” and make sure TOPCAT proposes the accref column as “Table Location” (if you don't see these items, update your TOPCAT – it's worth it). Now click on a row or perhaps a dot on a plot and behold an M spectrum.

  • From Byurakan to L2: Short Spectra

    A snapshot from the DFBS tutorial: Carbon Stars in different spectral bands.

    A snapshot from the DFBS tutorial: Carbon Stars in different spectral bands.

    On June 30, a small project we've done together with the Armenian Virtual Observatory has ended. Its objective was to publish the spectra from the First Byurakan Survey (the DFBS) in a VO-compilant way. The data comes from one of the big surveys with Schmidt telescopes that form a sizable part of the observational heritage from the second part of the 20th century (you're still using a few of them daily if you tell Aladin to show a DSS plane).

    In this case, spectra from objects on the entire northern sky off the milky way down to about 18th mag were obtained. In a previous cooperation between Armenian and Italian astronomers a good decade ago, the plates were digitised and calibrated, and spectra were extracted. However, they resided behind a web interface so far, which made them somewhat clumsy to work with.

    Now, they're in the VO, and to give you a few ideas for what kind of things you can do with this kind of data, within the project we've also written the tutorial “Outlier Analysis in Low-Resolution Spectra”.

    Have a glance at the tutorial – you see, while the Byurakan survey certainly is a valuable resource by itself, I happen to believe at this point it's particularly valuable because with the next Gaia data release (planned for next year), a deluxe version of it will come: Gaia's RP/BP spectra will be all-sky, properly calibrated, and quite a bit deeper, but still low-resolution. So, if you're just waiting for such a data collection, you can train your methods right now on the DFBS.

Page 1 / 1