Posts with the Tag Plates:

  • A Data Publisher's Diary: Wide Images in DASCH
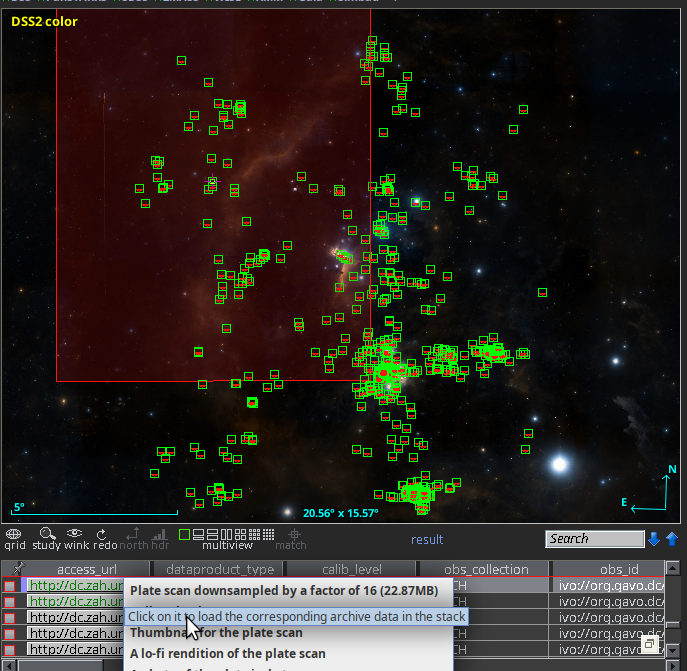
    An Aladin screenshot with many green squares overplotted on a DSS image sized 20×15 degrees.

    This is the new resonse when you query the DASCH SIAP service for Aladin's default view on the horsehead nebula. As you can see, at least the returned images no longer are distributed over half of the sky (note the size of the view).

    The first reaction I got when the new DASCH in the VO service hit Aladin was: “your SIAP service is broken, it just dumps all images it has at me rather than honouring my positional constraint.”

    I have to admit I was intially confused as well when an in-view search from Aladin came back with images with centres on almost half the sky as shown in my DASCH-in-Aladin illustration. But no, the computer did the right thing. The matching images in fact did have pixels in the field of view. They were just really wide field exposures, made to “patrol” large parts of the sky or to count meteors.

    DASCH's own web interface keeps these plates out of the casual users' views, too. I am following this example now by having two tables, dasch.narrow_plates (the “narrow” here follows DASCH's nomenclature; of course, most plates in there would still count as wide-field in most other contexts) and dasch.wide_plates. And because the wide plates are probably not very helpful to modern mainstream astronomers, only the narrow plates are searched by the SIAP2 service, and only they are included with obscore.

    In addition to giving you a little glimpse into the decisions one has to make when running a data centre, I wrote this post because making a provisional (in the end, I will follow DASCH's classification, of course) split betwenn “wide” and “narrow” plates involved a bit of simple ADQL that may still be not totally obvious and hence may merit a few words.

    My first realisation was that the problem is less one of pixel scale (it might also be) but of the large coverage. How do we figure out the coverage of the various instruments? Well, to be robust against errors in the astrometric calibration (these happen), let us average; and average over the area of the polygon we have in s_region, for which there is a convenient ADQL function. That is:

    SELECT instrument_name, avg(area(s_region)) as meanarea
    FROM dasch.plates
    GROUP BY instrument_name
    

    It is the power of ADQL aggregate function that for this characterisation of the data, you only need to download a few kilobytes, the equivalent of the following histogram and table:
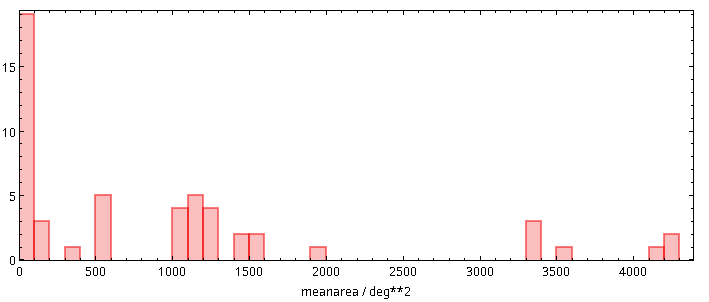
    A histogram with a peak of about 20 at zero, with groups of bars going all the way beyond 4000.  The abscissa is marked “meanarea/deg**2”.
    Instrument Name mean size [sqdeg]
    Eastman Aero-Ektar K-24 Lens on a K-1...  
    Cerro Tololo 4 meter  
    Logbook Only. Pages without plates.  
    Roe 6-inch  
    Palomar Sky Survey (POSS)  
    1.5 inch Ross (short focus) 4284.199799877725
    Patrol cameras 4220.802442888225
    1.5-inch Ross-Xpress 4198.678060743206
    2.8-inch Kodak Aero-Ektar 3520.3257323233624
    KE Camera with Installed Rough Focus 3387.5206396388453
    Eastman Aero-Ektar K-24 Lens on a K-1... 3370.5283986677637
    Eastman Aero-Ektar K-24 Lens on a K-1... 3365.539790633015
    3 inch Perkin-Zeiss Lens 1966.1600884072298
    3 inch Ross-Tessar Lens 1529.7113188540836
    2.6-inch Zeiss-Tessar 1516.7996790591587
    Air Force Camera 1420.6928219265849
    K-19 Air Force Camera 1414.074101143854
    1.5 in Cooke "Long Focus" 1220.3028263587332
    1 in Cook Lens #832 Series renamed fr... 1215.1434235932702
    1-inch 1209.8102811770807
    1.5-inch Cooke Lenses 1209.7721123964636
    2.5 inch Cooke Lens 1160.1641223648048
    2.5-inch Ross Portrait Lens 1137.0908812243645
    Damons South Yellow 1106.5016573891376
    Damons South Red 1103.327982978934
    Damons North Red 1101.8455616455205
    Damons North Blue 1093.8380971825375
    Damons North Yellow 1092.9407550755682
    New Cooke Lens 1087.918570304363
    Damons South Blue 1081.7800084709982
    2.5 inch Voigtlander (Little Bache or... 548.7147592220762
    NULL 534.9269386355818
    3-inch Ross Fecker 529.9219051692568
    3-inch Ross 506.6278856912204
    3-inch Elmer Ross 503.7932693652602
    4-inch Ross Lundin 310.7279860552893
    4-inch Cooke (1-327) 132.690621660727
    4-inch Cooke Lens 129.39637516917298
    8-inch Bache Doublet 113.96821604869973
    10-inch Metcalf Triplet 99.24964308212328
    4-inch Voightlander Lens 98.07368690379751
    8-inch Draper Doublet 94.57937153909593
    8-inch Ross Lundin 94.5685388440282
    8-inch Brashear Lens 37.40061588712761
    16-inch Metcalf Doublet (Refigured af... 33.61565584978583
    24-33 in Jewett Schmidt 32.95324914757339
    Asiago Observatory 92/67 cm Schmidt 32.71623733985344
    12-inch Metcalf Doublet 31.35112644688316
    24-inch Bruce Doublet 22.10390937657793
    7.5-inch Cooke/Clark Refractor at Mar... 14.625992810622787
    Positives 12.600189007151709
    YSO Double Astrograph 10.770798601877804
    32-36 inch BakerSchmidt 10 1/2 inch r... 10.675406541122827
    13-inch Boyden Refractor 6.409447066606171
    11-inch Draper Refractor 5.134521254785461
    24-inch Clark Reflector 3.191361603405415
    Lowel 40 inch reflector 1.213284257086087
    200 inch Hale Telescope 0.18792105301170514

    For the instruments with an empty mean size, no astrometric calibrations have been created yet. To get a feeling for what these numbers mean, recall that the celestial sphere has an area of 4 π rad², that is, 4⋅180²/π or 42'000 square degrees. So, some instruments here indeed covered 20% of the night sky in one go.

    I was undecided between cutting at 150 (there is a fairly pronounced gap there) or at 50 (the gap there is even more pronounced) square degrees and provisionally went for 150 (note that this might still change in the coming days), mainly because of the distribution of the plates.

    You see, the histogram above is about instruments. To assess the consequences of choosing one cut or the other, I would like to know how many images a given cut will remove from our SIAP and ObsTAP services. Well, aggregate functions to the rescue again:

    SELECT ROUND(AREA(s_region)/100)*100 AS platebin, count(*) AS ct
    FROM dasch.plates
    GROUP BY platebin
    

    To plot such a pre-computed histogram in TOPCAT, tell the histogram plot window to use ct as the weight, and you will see something like this:
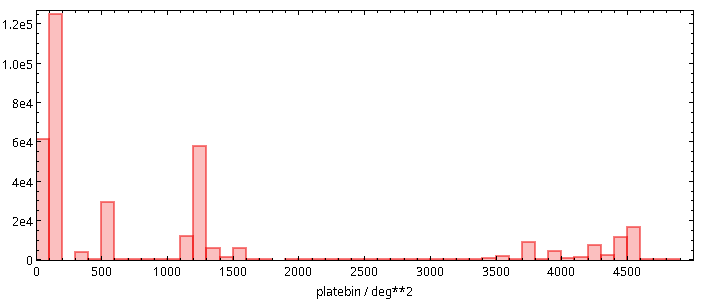
    A wide histogram with a high peak at about 50, rising to 1.2e5. Another noticeable concentration is around 1250, and there is signifiant weight also approaching 450 from the left.

    It was this histogram that made me pick 150 deg² as the cutoff point for what should be discoverable in all-VO queries: I simply wanted to retain the plates in the second bar from left.

  • DASCH is now in the VO

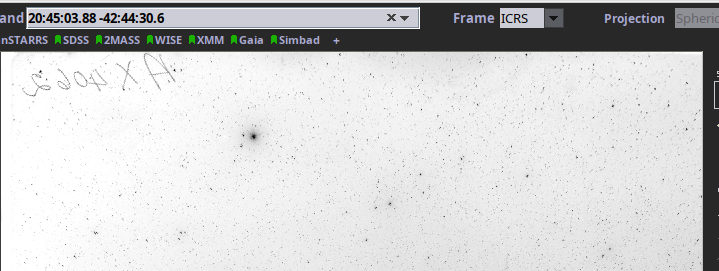
    Black dots on a white-ish background.  In the middle, some diffuse greyish stuff around a relatively large black dot.

    This frame would show comet 2P/Encke during its proximity to Earth in 1941 – if it went deep enough. But never mind practicalities: If you want to learn about matching ephemeris against the DASCH plate collection (or, really, any sort of obscore-like table), read on.

    For about a century – that is, into the 1980s –, being an observational astronomer meant taking photographic plates and doing tricks with them (unless you were a radio astronomer or one of the very few astronomers peeking beyond radio and optical in those days, of course). This actually is somewhat fortunate for archivists, because unlike many of the early CCD observations that by now are lost with our ability to read the tapes they were stored on, the plates are still there.

    Why Bother?

    However, to make them usable, the plates need to be digitised. In the GAVO data centre, we keep the results of several scan campaigns large and small, such as HDAP, the various data collections joined in the historical photographic plate image archive HPPA, or the delightfully quirky Münster Flare Plates.

    I personally care a lot about these data collections. This is partly because they are indispensible for understanding the history of astronomy. But more importantly, they are the next best thing we have to a time machine; if we have a way of knowing how the sky looked like seventy years ago, it is these plate collections. Having such a time machine is important for all kinds of scientific efforts, including figuring out whether there are aliens (i.e., 2016ApJ...822L..34S) on Tabby's Star.

    Somewhat to my chagrin, the cited paper 2016ApJ...822L..34S did not use the VO to obtain the plate images but went straight to DASCH's web interface. DASCH, in case you have not heard of it before, is probably the most ambitious project concerned with plate digitisation at the moment – or perhaps: “was”, because they just finished scanning the core part of Harvard's plate collections, which was their primary goal.

    I can understand why Bradley Schaefer, the paper's author, did not bother with a VO search In 2016. For starters, working with halfway homogeneous data from instruments you are somewhat familiar saves a substantial amount of work and thought, in particular if you are, in addition, up against the usual lack of machine-readable metadata. Also, at that time DASCH probably had about as many digitised plates as all the VO's contemporary plate collections taken together.

    DASCH: The Harvard Plates

    Given such stats, I have always wanted to have at least the metadata from DASCH's plates in the VO. Thanks to a recent update to DASCH's publication system, this is now a reality. Since 2024-04-29, I am publishing the metadata of the DASCH plates via Obscore and and SIAP2.

    Followup (2024-05-03)

    This is now DASCH news, and one of my two main contacts on the DASCH side, Peter Williams, has written an insightful post on this, too. Let me use this opportunity to thank him for the delightful cooperation, and extend these thanks to Ben Sabath, who is primarily responsible for the update to the DASCH publication system I mentioned above.

    Matching plates are returned as datalink documents, pointing to a preview, photos of the plate and its jacket, and links to the science data, once downsampled by a factor of 16, once in the original size (example). For now, #this points to the downsampled version, as Amazon charges DASCH about three cents per full-scale plate at the moment, and that can quickly add up by accident (there's nothing wrong with consciously downloading full-scale FITS-es if you need them, of course).

    This is a bit fishy in that the size of the image in the obscore/SIAP2 fields s_xel1 and s_xel2 refers to the unscaled image, and thus I should be returning the full-scale image as datalink #this. I hope I will not cause much confusion with this design.

    In case you look at the links in the datalink documents, let me include a disclaimer: Although they point into the GAVO data centre, the data is served courtesy of the DASCH project. The links only go to us because we need to sign links for you. I mention this because you can save the datalink documents and the links within them; the URLs you are redirected to from there, however, will expire fast. Just do not look at them.

    Plates in Global Discovery

    So – what can you do with DASCH in the VO that you could not do before?

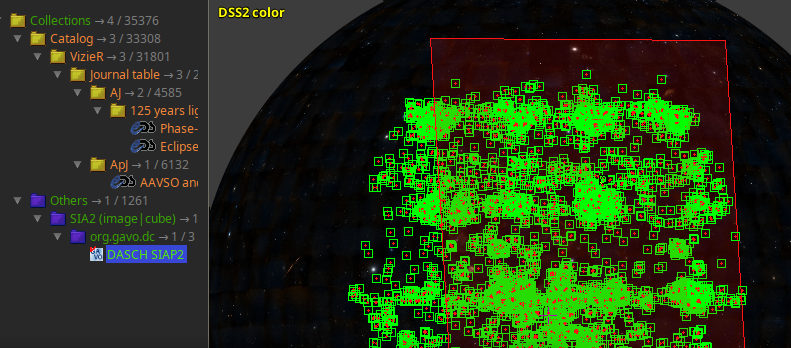
    Most importantly, you will discover DASCH in registry interfaces and its datasets in global queries (in particular the global dataset queries I have discussed a few weeks ago). For instance, DASCH is now in Aladin's discovery tree:

    A screen shot with many selected points, highlighted in green, on the right side.  On the left side, an tree display with many branches folded in.  On a folded-out branch, there is “DASCH SIAP2“ highlighted.  On the right side, there is a large rectangle overplotted in red.

    You can now find DASCH in Aladin and do the usual “in view“ searches. However, currently this yields many matches that are, in practical terms, spurious, as they come from extremely wide-angle instruments. The red rectangle is the footprint of one of these images; note that the view here is a full two pi sky. We will probably do something about this “noise“.

    The addition of DASCH to the VO has a strong effect in some use cases. For instance, at the end of the GAVO plates tutorial, we do an all-VO obscore query that, at the time of the last update of the tutorial in 2019, yielded 4067 datasets (of course, including modern and/or non-optical observations) potentially showing some strongly lensed quasar. With DASCH – and, admittedly, a few more collections that came into the VO since 2019 –, that number is now 10'489; the range of observation dates grew from MJD 12550…52000 to MJD 9800…58600, with the mean decreasing from 51'909 to 30'603. That the mean observation date moves that much back in time is a certain sign that a major part of the expansion is due to DASCH (well, and certainly to APPLAUSE, too).

    Followup (2024-05-03)

    As discussed in my DASCH update, I have taken out the large-coverage plates from my obscore table, which changes the stats (but not the conclusions) quite a bit. They is now 10'098 plates and mean observation date 36'396

    TAP, Uploads, and pyVO on DASCH

    But this is not just about bringing astronomical heritage to the VO. It is also about exposing DASCH through the powerful ADQL/TAP interface. As an example of how this may be useful, consider the comet P2/Encke, which, according to JPL's Small-Body Database was relatively close to Earth (about half an AU) in May 1941. It would have had about 14.5 mag at that point and hence was safely within reach of several of the instruments archived in DASCH. Perhaps we can find serendipitous or even targeted observations of the comet in the collection?

    The plan to find that out is: compute an ephemeris (we are lazy and use an external service, Miriade ephemcc) and then for each day see whether there are DASCH observations in the vicinity of the sky location obtained in this way.

    As usual, it's never that easy because the call to the ephemeris webservice (paste the link into TOPCAT to have a look) returns cursed sexagesimal coordinates. We need to fix them before doing anything serious with the table, and while we are at it, we also repair the date, which is simpler to consume if it is MJD to begin with. Getting the ephemeris thus takes quite a few lines:

    from astropy import table
    from astropy import units as u
    from astropy.coordinates import SkyCoord
    from astropy.time import Time
    
    ephem = table.Table.read(
      "https://vo.imcce.fr/webservices/miriade/ephemcc.php?-from=vespa"
      "&-name=c:p/encke&-ep=1941-04-01&-nbd=90&-step=1d&-observer=500"
      &-mime=votable")
    
    parsed = SkyCoord(ephem["ra"], ephem["dec"], unit=(u.hourangle, u.deg))
    ephem["ra"] = parsed.ra.degree
    ephem["dec"] = parsed.dec.degree
    
    parsed = Time(ephem["epoch"])
    ephem["epoch"] = parsed.mjd
    

    Compared to that, the actual matching against DASCH is almost trivial if you are somewhat familiar with crossmatching in ADQL and the Obscore schema:

    svc = pyvo.dal.TAPService("http://dc.g-vo.org/tap")
    res = svc.run_sync("""
        SELECT *
        FROM
            dasch.plates
            JOIN tap_upload.orbit
            ON (1=CONTAINS(POINT(ra, dec), s_region))
        WHERE
            t_min<epoch
            AND t_max>epoch""",
        uploads={"orbit": ephem})
    

    Followup (2024-05-03)

    You would probably query the dasch.narrow_plates table in actual operations; querying dasch.plates is probably more for people interested in the history of astronomy or DASCH itself.

    Inspect the query for a moment: This is a normal upload join, except we are constructing an ADQL POINT on the fly to be able to see whether we are in the spatial region covered by a DASCH dataset (given in obscore's s_region column). We could have put the temporal condition into the join's ON; but I think the intention is somewhat clearer with the WHERE constraint, and the database engine will probably go through identical motions for both queries – the beauty of having a query planner in the loop is that you do not need to think about such details most of the time.

    Actually, in this case there is one last complication: As said above, we have put a datalink service between you and the downloads to discourage accidental large downloads. We hence use pyVO's (suboptimally documented) datalink interface (iter_datalinks):

    with pyvo.samp.connection() as conn:
        for dl in res.iter_datalinks():
            link = next(dl.bysemantics("#preview-image"))
            pyvo.samp.send_image_to(
                conn,
                link.access_url,
                client_name="Aladin")
    

    Among the artefacts available we pick the scaled jpegs in this fragment (#preview-image), since these are almost free even on the Amazon cloud. Change that #preview-image to #this in the to get scaled calibrated FITS-es, which are still fairly small. This would, for instance, let you overplot the ephemeris in Aladin, which you cannot do with the jpegs as they lack astrometric calibration (for now). But even with #preview-image, we can use Aladin as a glorified image viewer by SAMP-sending the images there, which is why we do the minor magic with functions from pyvo.samp.

    If you want to try this yourself or mangle the program to do something else that requires querying against a reasonable number positions in time and space, just get encke.py and hack away. Make sure to start Aladin before running the program so it has something to send the images to.

    Disclaimers

    This is a contrived example, and it is likely that this particular use case is astronomically wrong in several ways. Let me enumerate a few things that would need looking into before this approaches proper science:

    • We compute the ephemeris for the center of the Earth. At half an AU distance, the resulting parallax will not shift the position enough to hide a plate we should know about, but at least for anything closer, you should try to do a bit better; admittedly, for a resource like DASCH – that contains plates from observatories all over the place – you will have to compromise.
    • The ephemeris is probably wrong; comet's orbits change over time, and I have no idea if the ephemeris service actually uses 2P/Encke's 1941 orbit to compute the positions.
    • The coordinate metadata may be wrong. Ephemcc's documentation says something that sounds a lot as if they were sometimes returning RA and Dec for the equator of the time rather than for J2000 (i.e., ICRS for all intents and purposes), but of course our obscore coverages are for the ICRS. Regrettably, the VOTable returned by the service does not contain a COOSYS element yet, and so there is no easy way to tell.
    • If you look at the table with DASCH matches, you will see they all were observed with an extremely wide-angle instrument sporting an aperture of a mere three inches. Even at the whopping exposure times (two hours), there is probably no way you would see a diffuse object of 14th mag on a plate with a 1940s-era photographic emulsion with that kind of optics (well: feel free to prove me wrong).
    • It would of course be a huge waste of bandwidth to pull the entire plates if we already had a good idea of where we would expect the comet (i.e., had a reliable ephemeris). Hence, a cutout service that would let you retrieve more or less exactly the pixels you would like to use for your research and not the cruft around it would be a nifty supplement. It's in the works, and I'd say you can almost hold your breath. The cutout will simply appear as a SODA service in the datalink documents. See 2020ASPC..522..295D for how you would operate such a service.
  • Computing Residuals of an Astrometric Calibration

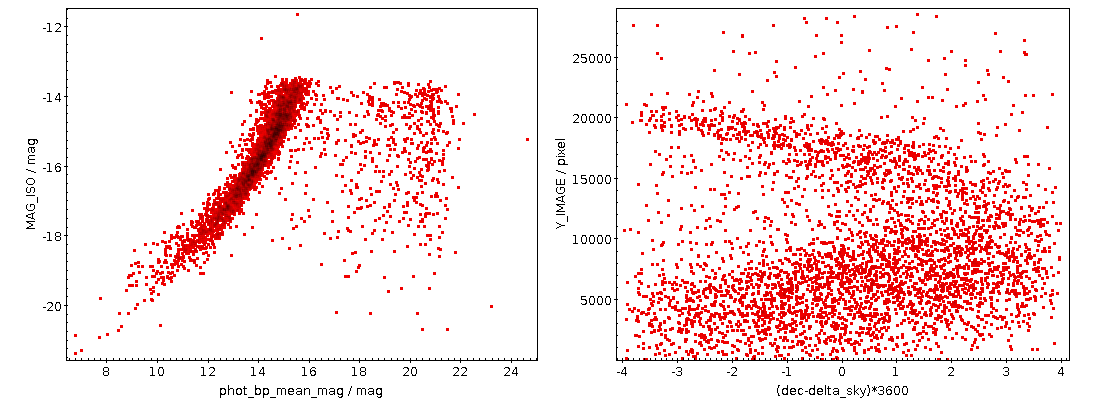
    Two plots, left a fairly good correlation, right a cloudy wave

    The kind of plot you can make following the recipe given here: Left, a comparison of the photometry, right, a positional residuals, not taking into account the SIP plate solution, when comparing the HDAP plate B3261a against Gaia DR3. Note that the cut-off a 4 arcsec is because of the match radius when obtaining the calibrator stars.

    I recently had to assess the quality of the astrometric calibration of a photographic plate. What I am going to show you in this post will of course work just as well for CCD frames, and if these have a sufficiently large field of view, this may be an issue for them as well. However, the sort of data that needs this assessment most typically are scans of plates, as these tend to have a “wobble”, systematic offsets in the scan direction resulting from imperfections in the mechanics.

    Prerequisites: An astronomical frame with a calibration in ICRS (or some frame not very far from it), called my-image.fits in the following, SExtractor (in Debian and derivatives: apt install source-extractor – long live Debian Astro; since it's called source-extractor in Debian, that's what I'll use here, too), and of course TOPCAT.

    Step 1: Extract Sources. Source extraction is of course a high science, and if you know better than me, by all means do it the way you think is appropriate. Meanwhile, the following might very well work for you sufficiently well.

    Create a working directory and enter it. Then, to create a file telling source-extractor what columns you would like to see, write the following to a file default.param:

    ALPHA_SKY
    DELTA_SKY
    X_IMAGE
    Y_IMAGE
    MAG_ISO
    FLUX_AUTO
    ELONGATION
    

    Next, give a few parameters to source-extractor; depending on the sort of image you have, you may want to play around with DETECT_MINAREA (how many pixels need to show a signal to register as a source) and DETECT_THRESH (how many sigmas a pixel has to be above the background to register as a candidate for belonging to a source). Meanwhile, write the following into a file default.control:

    CATALOG_TYPE     FITS_1.0
    CATALOG_NAME     img.axy
    PARAMETERS_NAME  default.param
    FILTER           N
    DETECT_MINAREA   30
    DETECT_THRESH    4
    SEEING_FWHM      1.2
    

    – but if the following call gives you a few hundred sources, that ought to work for the present purpose.

    Then run:

    source-extractor -c default.control my-image.fits
    

    This will give you a catalogue of extracted objects in the file img.axy.

    Step 2: Fix source-extractor's output. Load that img.axy into TOPCAT. Regrettably, source-extractor does not add any useful metadata to the columns of its output table. To add the absolute bare minimum, in TOPCAT go to ViewsColumn Info. In that window, check UCD in the Display menu, and then put pos.eq.ra and pos.eq.dec into the UCD fields of the ALPHA_SKY and DELTA_SKY columns, respectively; double click to change fields in TOPCAT.

    To see if you have done the annotation right, in TOPCAT's main window, click GraphicsSky Plot. If the objects show up, you have just provided enough annotation to let TOPCAT figure out the position for each row.

    Step 3: Get calibrators. We will now try to add counterparts for Gaia DR3 to the extracted sources. To do that, click VOTable Access Protocol, and in the window popping up double click the entry for the GAVO DC TAP.

    In the Find box, type dr3lite to look for this site's version of the Gaia DR3 source catalogue. Click on gaia.dr3lite to select that table, and then select the Columns pane. This should show some of the Gaia DR3 columns.

    Now ExamplesUpload Join will generate a query that will cross-match your extracted sources with the Gaia sources. You should edit it a bit, only selecting the columns you will actually need, removing the TOP 1000 (at least on large images with more than 1000 sources), and reducing the match radius a bit when the calibration is not actually completely off and your epoch is sufficiently close to J2000.

    Hint: you can control-click in the Columns pane and then use the Cols button to insert all the column names in one go[1]. For me, the resulting query would be:

    SELECT
       source_id, ra, dec, phot_bp_mean_mag,
       tc.*
       FROM gaia.dr3lite AS db
       JOIN TAP_UPLOAD.t1 AS tc
       ON 1=CONTAINS(POINT('ICRS', db.ra, db.dec),
                     CIRCLE('ICRS', tc.ALPHA_SKY, tc.DELTA_SKY, 4./3600.))
    

    This should result in about as many matches as your extraction had – a few more is ok, because you will have some spurious matches, a few less is ok, too, as there are always some outliers and artefacts, but you should clearly not pull a magnitude more or less objects here than you put in; fiddle with the match radius as necessary.

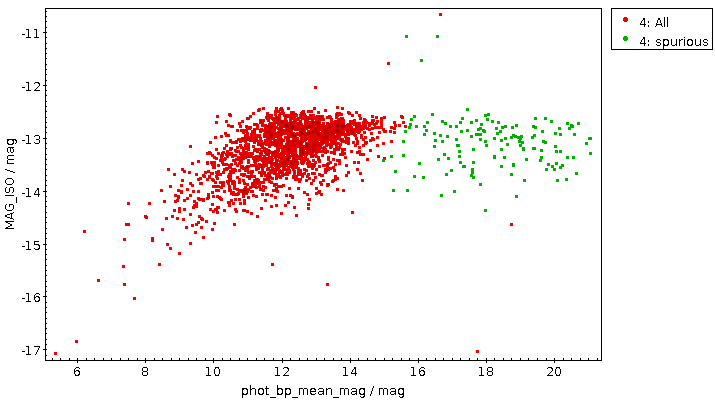
    See if there is a rough correlation between the Gaia calibrators and your extracted sources by plotting phot_bp_mean_mag against MAG_ISO. Absent more information, MAG_ISO, source-extractor's guess for the magnitude of the extracted object, will be just some crazy number, but it should have some discernable correlation with the actual magnitude. Do not expect too much here, in particular with old plates, for which good photometry is a science of their own.

    In my example, this looked like this:

    Plot: a rough correlation in red with a green tail

    The green points certainly are spurious matches; this observation did not reach beyond 14th magnitude or so, and there are many weak stars on the sky, so a few of them will show up in just about any cross match. See the opening picture for an example with a better correlation.

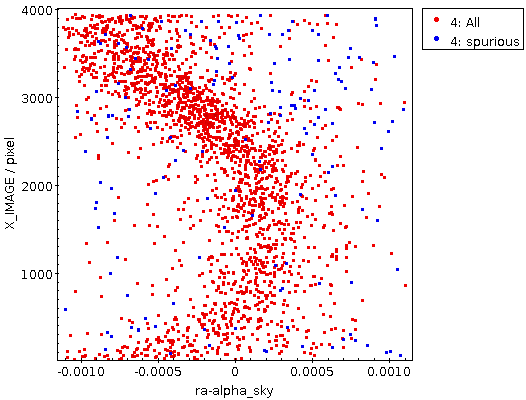
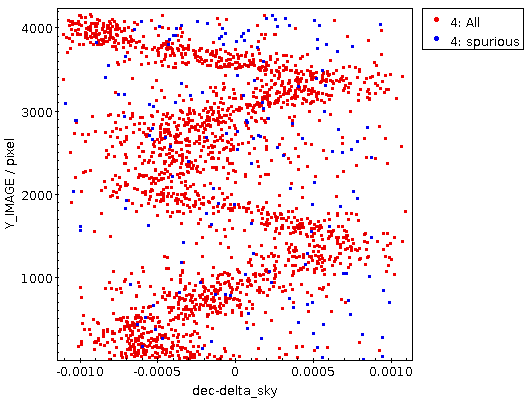
    Step 4: Do the correlation plot. Do GraphicsPlane Plot and then plot ra-alpha_sky or dec-delta_sky against X_IMAGE or Y_IMAGE. You could get something like this:

    Plot: A single wavy thing

    This rather certainly reflects some optical distortion; source-extractor regrettably does not take into account SIP corrections yet, so it is likely that a large part of this would be taken care of by the polynomials of the plate solution (the github issue I am linking to tells you how to be sure).

    But it can also look like this:

    Plot: Multiple wobbles

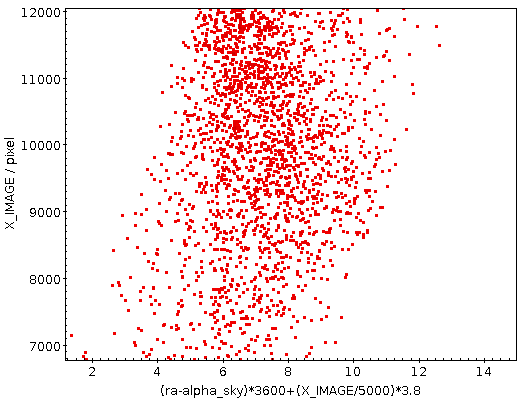
    This certainly is not the result of a lens or anything optical at all. It's the scanner's gears that you are looking at here. With an amplitude of perhaps three arcseconds this is rather excessive here; but something like this you will rather likely see even on good scanners – though it may essentially be invisible, as of the Heidelberg scanner we used for HDAP:

    Plot: A vertical cloud with no discernible structure.
    [1]I'm using the BP magnitude in the query below as most historical plates tend to be “blue sensitive“ (in some sense). Hence, BP magnitudes should be a bit closer to what source-extractor has extracted.
  • APPLAUSE via Obscore

    A composite of two rather noisy photo plates

    Aladin showing some Bamberg Sky Patrol plates (see towards the end of the post for what this is and how I made it).

    At the Astroplate conference I blogged about recently, the people behind APPLAUSE gave a couple of talks about their Data Release 3. APPLAUSE is a fairly massive endeavour to make available data from some of the larger plate archives in Germany, and its DR3 even hit the non-Astronomy press last February.

    Already for previous APPLAUSE releases, I've wanted to bring this data (or rather, its metadata) to the VO, but it never quite happened, basically because there was always another little thing that turned out to be too tedious to work out via mail. However, working out things interactively is exactly what conferences are great for. So, the kind APPLAUSE folks (thanks, Taavi and Harry) and I used the Astroplate to map their database schema (“schema” is jargon for what boils down to the set of tables and columns with which they describe their data) to the much simpler (and, admittedly, less powerful) IVOA Obscore one.

    Sure, Obscore doesn't deal with multiple exposures (like when the target field and the north pole were exposed on one plate to help precision photometry), object-guided images, and all the other interesting techniques that astronomers applied in the pre-digital age; it also doesn't usefully cope with multiple scans of the same plate (for instance, to correct for imprecisions in the mechanics of flatbed scanners). APPLAUSE, of course, has to cope with them, since there are many reasons to preserve data of this kind.

    Obscore, on the other hand, is geared towards uniform discovery, where too funky datasets in all likelihood cause more harm than good. So, when we mapped APPLAUSE to Obscore, of the 101138 scans of 70276 plates that the full APPLAUSE holds in DR3, only 44000 plate scans made it into the Obscore table. The advantage: whatever can be sensibly mapped to Obscore can now be queried together with all the other data in the world that others have published through Obscore.

    You can immediately see the effect when you run the little python program doing the global discovery we gave in our plates tutorial. Here's what it prints now (values from pre-APPLAUSE-in-Obscore are in square brackets):

    Column t_exptime: 3460 values
      Min   12, Max 15300, Mean 890.24  [previous mean: 370.722]
    ---
    Column em_mean: 3801 values
      Min 1.8081e-09, Max 9.3e-07, Mean 6.40804e-07 [No change: Sigh!]
    ---
    Column t_mean: 4731 values
      Min 12564.5, Max 58126.3, Mean 49897.9 [previous mean: 51909.1]
    ---
    Column instrument_name: 4747 values
      Matches from , Petzval, [Max Wolf's residence in
      Heidelberg, Maerzgasse, Wolf's Doppelastrograph,
      Heidelberg Koenigstuhl (24), Wolf's
      Doppelastrograph,] AG-Astrograph, [Zeiss Triplet
      15 cm Potsdam-Telegrafenberg], Zeiss Triplet,
      Astrograph (four 10-cm Tessar f/6 cameras),
      [3.5m APO, ROSAT PSPCC, Heidelberg Koenigstuhl
      (24), Bruce Astrograph, Calar Alto (493),
      Schmidt], Grosser Refraktor, [ROSAT HRI,
      DK-1.54], Hamburger Schmidt-Spiegel,
      [DFOSC_FASU], ESO 1-metre Schmidt telescope,
      Great Schmidt Camera, Lippert-Astrograph, Ross-B
      3", [AZT 22], Astrograph (six 10-cm Tessar f/6
      cameras), 1m-Spiegelteleskop, [ROSAT PSPCB],
      Astrograph (ten 10-cm Tessar f/6 cameras), Zeiss
      Objective
    ---
    Column access_url: 4747 values [4067]
    

    So – for the fields selected in the tutorial, there are 15% more images in the global Obscore image pool now than there were before APPLAUSE, and their mean observation date went a bit farther into the past. I've not made any statistics, but I suspect for many other fields the gain is going to be much higher. For a strong effect, try some random region covered by the Bamberg Sky Patrol on the southern sky.

    But you have probably noticed the deep sigh in the annotations to the statistics above: Yes, we don't have the spectral band for the APPLAUSE data, which is why the stats on em_min doesn't change. As a matter of fact, from the Obscore data you can't even guess whether a plate is “more red” or “rather blue”, as Obscore doesn't have an (agreed-upon) field for “qualititive bandpass indicator”.

    For some other data collections, we did map known emulsion/filter combinations to rough bandpasses (e.g., the Palomar-Leiden Trojan Survey, which only had a few of them). For APPLAUSE, there are 435 combinations of filter and emulsion (that's a VOTable link that you can paste into TOPCAT's load button in order to have a look at the table). Granted, quite a few of these pairs are (more or less) spurious because of inconsistent spelling. But we still gave up on researching the bandpasses even before we started.

    If you're a photographic plate buff: You could help us and posteriority a lot if you could go through this list and at least for some combinations tell us what, roughly, the lower and upper limits of the corresponding bandpasses might have been (what DaCHS already knows, plate-relevant data near the bottom of the file). As usual, send mail to gavo@ari.uni-heidelberg.de if you have anything to contribute.

    Finally, here's the brief explanation of the image for this article: Well, I wanted to find some Bamberg Sky Patrol images for a single field to play with. I knew they were primarily located in the South, and were made using Tessar cameras. So, I ran:

    SELECT t_min, access_url, s_region
    FROM ivoa.obscore
    WHERE instrument_name like '%Tessar%'
    AND 1=CONTAINS(POINT(345, -38), s_region)
    

    on GAVO's TAP service. Since Aladin 10, you can do that from within the program (although some versions will reject this query because they mistakenly believe the ADQL is bad. Query through TOPCAT and send the result over to Aladin if that bites you). Incidentally, when there are s_region values in Obscore tables, it's a good idea to use them as I do here, as it's quite a bit more likely that this query will use indices than some condition on s_ra and s_dec. But then not all services fill s_region properly, so for all-VO queries you will probably want to make do with s_ra and s_dec.

    From that result I first made the inset bar graph in the article image to show the temporal distribution of the Patrol plates. And then I grabbed two (rather randomly selected) plates and had Aladin produce a red-blue composite of them. Whatever is really red or really blue in that image may correspond to a transient event. Or, as certainly the case with that little hair (or whatever) that shines out in blue, it may not.

  • Small Telescopes, Large Surveys

    Image: Blink comparator and survey camera

    Plate technology at Bamberg observatory: a blink comparator with one plate mounted, and a survey camera that was once used at Boyden Station, an astronomer outpost in 60ies South Africa.

    I'm currently at the workshop “Large surveys with small telescopes: past, present, and future” (or Astroplate III for short) in Bamberg, where people are discussing using and re-using the rich heritage of historical observations (hence the “plate” part) as well growing that heritage in the age of large CCDs, fast computers and large disks.

    Using and re-using is of course what the Virtual Observatory is about, and we've been keeping fairly large plate collections in our data center for quite a while (among them the Archives of Landessternwarte Königstuhl or the Palomar-Leiden Trojan surveys, and there is the WFPDB TAP-accessibly). Therefore, people from GAVO Heidelberg have been to all past astroplate conferences.

    For this one, I brought a brand-new tutorial on plate scans in the VO, which, I hope, also works as a general introduction to image discovery in the VO using SIAP, Datalink, and Obscore. If you're doing image stuff now and then, please have a quick look at the thing – I am particularly grateful for hints on what to improve or perhaps particularly obvious use cases for the material discussed.

    Such VO proselytising aside, the conference is discussing the wide variety of creative, low-cost data collectors out there as well as computer-aided re-analysis extracting new knowledge from decades-old data. If I had to choose a single come-to-think-of-it moment, it would be Norbert Zacharias' observation that if you have a well-behaved object and you'd like to know where it was in 1900, it's now more accurate to extrapolate Gaia astrometry to the epoch of observation than to measure it on the plate itself. Which is saying a lot about the amazing feat of engineering that Gaia is.

    This is not, however, an argument for dumping the old data. Usually, it is exactly what is not so well-behaved (like those) that's interesting – both in terms of astrometry and in terms of photometry (for which there's a lot more unruly behaviour in the first place). To figure out how objects don't behave well, and, for objects disguising as well-behaved only on time scales of the (say) Gaia mission, which these are, the key is “old” data. The freshness of which we're discussing this week.

Page 1 / 1