![[RSS]](../theme/image/rss.png)
Multimessenger Astronomy and the Virtual Observatory
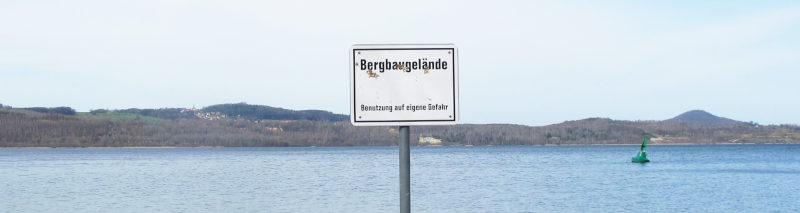
It's pretty in Görlitz, the location of the future German Astrophysics Research Centre DZA. The sign says “Mining area, enter at your own risk”. Indeed, the meeting this post was inspired by happened on the shores of a lake that still was an active brown coal mine as late as 1997.
This week, I participated in the first workshop on multimessenger astronomy organised by the new DZA (Deutsches Zentrum für Astrophysik), recently founded in the town of Görlitz – do not feel bad if you have not yet heard of it; I trust you will read its name in many an astronomy article's authors' affiliations in the future, though.
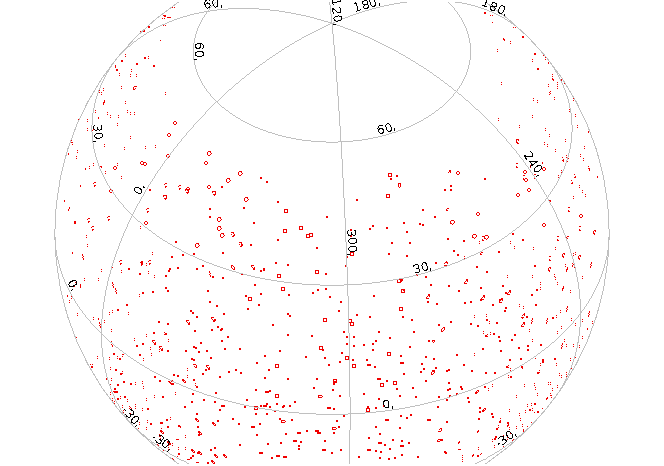
I went there because facilitating research across the electromagnetic spectrum and beyond (neutrinos, recently gravitational waves, eventually charged particles, too) has been one of the Virtual Observatory's foundational narratives (see also this 2004 paper from GAVO's infancy), and indeed the ease with which you can switch between wavebands in, say, Aladin, would have appeared utopian two decades ago:
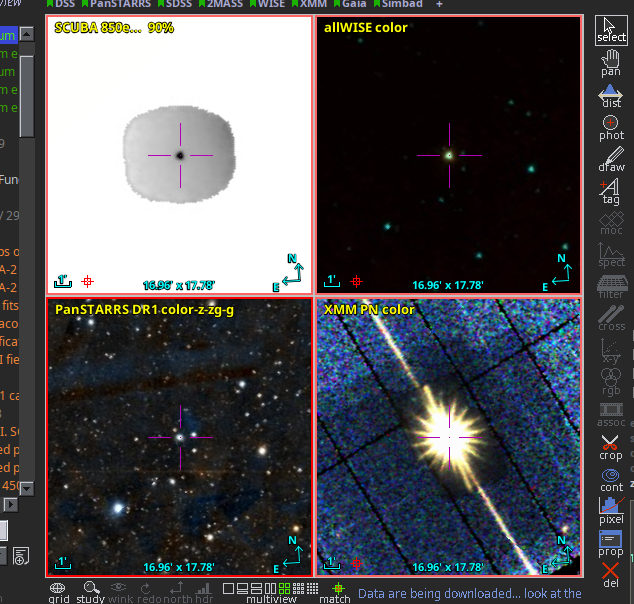
That's the classical quasar 3C 273 in radio, mid-infrared, optical, and X-rays, visualised within a few seconds thanks to the miracles of HiPS and Aladin.
But of course research-level exploitation of astronomical data is far from a solved problem yet. Each messenger – and I would consider the concepts in the IVOA's messenger vocabulary a useful working definition for what sorts of messengers there are[1] – holds different challenges, has different communities using different detectors, tools and conventions.
For instance, in the radio band, working with raw-ish interferometry data (“visibilities”) is common and requires specialised tools as well as a lot of care and experience. Against that, high energy observations, be them TeV photons or neutrinos, have to cope with the (by optical standards) extreme scarcity of the messengers: at the meeting, ESO's Xavier Rodrigues (unless I misunderstood him) counted one event per year as viable for source detection. To robustly interpret such extremely low signal levels one in particular needs extremely careful modelling of the entire observation, from emission to propagation through various media to background contamination to the instrument state, with a lot of calibration and simulation data frequently necessary to make statistical sense of even fairly benign data.
The detectors for graviational waves, in turn, basically only match patterns in what looks like noise even to the aided eye – at the meeting, Samaya Nissanke showed impressive examples –, and when they do pick up a signal, the localisation of the signal is a particular challenge resulting, at least at this point, in large, banana-shaped regions.
At the multimessenger workshop, I was given the opportunity to delineate what, from my Virtual Observatory point of view, I think are requirements for making multi-messenger astronomy more accessible “for the masses”, that is for researchers that do not have immdiate access to experts for a particular sort of messenger. Since a panel pitch is always a bit cramped, let me give a long version here.
Science-Ready is an Effort
The most important ingredient is: Science-ready data. Once you can say “we get a flux of X ± Y Janskys from a σ-circle around α, δ between T1 and T2 and messenger energy E1 and E2” or “here is a spectrum, i.e., pairs of sufficiently many messenger energy intervals and a calibrated flux in them, for source S”, matters are at least roughly understandable to visitors from other parts of the spectrum.
I will not deny that there is still much that can go wrong, for instance because the error models of the data can become really tricky for complex instruments doing indirect measurements (say, gamma-ray telescopes observing atmospheric showers). But having to cope with weirdly correlated errors or strong systematics is something that happens even while staying within your home within the spectrum – I had an example from the quaint optical domain right here on my blog when I posted on the Gaia XP spectra –, so that is not a problem terribly specific to the multi-messenger setting.
Still, the case of the Gaia XP spectra and the sampling procedure Rene has devised back then are, I think, a nice example for what “provide science-ready data” might concretely mean: work, in this case, trying to de-correlate data points so people unfamiliar with the particular formalism used in Gaia DR3 can do something with the data with low effort. And I will readily admit that it is not only work, it also sacrifices quite a bit of detail that may actually be in the data if you spend more time with the individual dataset and methods.
That this kind of service to people outside of the narrower sub-domain is rarely honoured certainly is one of the challenges of multi-messenger astronomy for the masses.
Generality, Systematics, Statistics
But of course the most important part of “science-ready” is removing instrument signatures. That is particularly important in multi-messenger astronomy because outside users will generally be fairly unfamiliar with the instruments, even with the types of instruments. Granted, even within a sub-domain setting up reduction pipelines and locating calibration data is rarely easy, and it is not uncommon to get three different answers when you ask two instrument specialists about the right formalism and data to calibrate any given observation. But that is not much compared with having to understand the reduction process of, say, LIGO, as someone who has so far mainly divided by flatfields.
Even in the optical, serving data with strong instrumental signatures (e.g., without flats and bias frames applied) has been standard until fairly recently. Many people in the VLBI community still claim that real-space data is not much good. And I will not dispute that carefully analysing the systematics of a particular dataset may improve your error budget over what a generic pipeline does, possibly even to the point of pushing an observation over the significance threshold.
But against that, canned science-ready data lets non-experts at least “see” something. That way, they learn that there may be some signal conveyed by a foreign messenger that is worth a closer look.
Enabling that “closer look” brings me to my second requirement for multimessenger astronomy: expert access.
From Data Discovery to Expert Discovery
Of course, on the forefront of research, an extra 10% systematics squeezed out of data may very well make or break a result, and that means that people may need to go back to raw(er) data. Part of this problem is that the necessary artefacts for doing so need to be available. With Datalink, I'd say at least an important building block for enabling that is there.
Certainly, that is not full provenance information yet – that would, for instance, include references to the tools used in the reduction, and the parameters fed to them. And regrettably, even the IVOA's provenance data model does not really tell you how to provide that. However, even machine-readable provenance will not let an outsider suddenly do, say, correlation with CASA with sufficient confidence to do bleeding-edge science with the result, let alone improve on the generic reduction hopefully provided by the observatory.
This is the reason for my conviction that there is an important social problem with multi-messenger astronomy: Assuming I have found some interesting data in unfamiliar spectral territories and I want to try and improve on the generic reduction, how do I find someone who can work all the tools and actually know what they are doing?
Sure, from registry records you can find contact information (see also the .get_contact() in pyVO's registry API), but that is most often a technical contact, and the original authors may very well have moved on and be inaccessible to these technical contacts. I, certainly, have failed to re-establish contact to previous data providers to the GAVO data centre in two separate cases.
And yes, you can rather easily move to scholarly publications from VO results – in particular if they implement the INFO elements that the new Data Origin in the VO note asks for–, but that may not help either when the authors have moved on to a different institution, regardless of whether that is a scholarly or, say, banking institution.
On top of that, our notorious 2013 poster on lame excuses for not publishing one's data has, as an excuse: “People will contact me and ask about stuff.” Back then, we flippantly retorted:
Well, science is about exchange. Think how much you learned by asking other people.
Plus, you’ll notice that quite a few of those questions are actually quite clever, so answering them is a good use of your time.
As to the stupid questions – well, they are annoying, but at least for us even those were eye-openers now and then.
Admittedly, all this is not very helpful, in particular if you are on the requesting side. And truly I doubt there is a (full) technical solution to this problem.
I also acknowledge that it even has a legal side – the sort of data you need to process when linking up sub-domain experts and would-be data users is GDPR-relevant, and I would much rather not have that kind of thing on my machine. Still, the problem of expert discovery becomes very pertinent whenever a researcher leaves their home turf – it's even more important in cross-discipline data discovery[2] than in multiwavelength. I would therefore advocate at least keeping the problem in mind, as that might yield little steps towards making expert discovery a bit more realistic.
Perhaps even just planning for friendly and welcoming helpdesks that link people up without any data processing support at all is already good enough?
Blind Discovery
The last requirement I have mentioned in my panel discussion pitch for smooth multi-messenger astronomy is, I think, quite a bit further along: Blind discovery. That is, you name your location(s) in space, time, and spectrum, say what sort of data product you are looking for, and let the computer inundate you with datasets matching these constraints. I have recently posted on this very topic and mentioned a few remaining problems in that field.
Let me pick out one point in particular, both because I believe there is substantial scientific merit in its treatment and because it is critical when it comes to efficient global blind discovery: Sensitivity; while for single-object spectra, I give you that SNR and resolving power are probably enough most of the time, for most other data products or even catalogues, nothing as handy is available across the spectrum.
For instance, on images (“flux maps”, if you will) the simple concept of a limiting magnitude obviously does not extend across the spectrum without horrible contortions. Replacing it with something that works for many messengers, has robust and accessible statistical interpretations, and is reasonably easy to obtain as part of reduction pipelines even in the case of strongly model-driven data reduction: that would be high art.
Also in the panel discussion, it was mentioned that infrastructure work as discussed on these pages is thankless art that will, if your institute indulges into too much of it, get your shop closed because your papers/FTE metric looks too lousy. Now… it's true that beancounters are a bane, but if you manage to come up with such a robust, principled, easy-to-obtain measure, I fully expect its wide adoption – and then you never have to worry about your bean^W citation count again.
| [1] | In case you are missing gravitational waves: there has been a discussion about the proper extension and labelling of that concept, and it has petered out the first time around. If you miss them operationally (which will give us important hints about how to properly include them), please to contact me or the IVOA Semantics WG. |
| [2] | Let me use this opportunity to again solicit contributions to my Stories on Cross-Discipline Data Discovery, as – to my chagrin – it seems to me that beyond metrics (which, between disciplines, are even more broken than within any one discipline) we lack convincing ideas why we should strive for data discovery spanning multiple disciplines in the first place. |