Articles from Operations

  • Taming the Postgres JIT

    Mild warning: This is exclusively technobabble mainly addressing DaCHS deployers. If you're an astronomer (or yet something else), you're of course still welcome to enjoy it, but don't complain if you're bored.

    My development machine as been on Debian bullseye for a while, which means I've been running Postgres 13 for the past few months. Against Postgres 11, 13 is a lot more optimistic when doing Just-In-Time (JIT) compilation, and that's the beginning of this story.

    This JIT thing in plain language means that Postgres is writing small programmes to compute query results, then compiles them to machine code and executes that rather than running the query plan in some sort of interpreter. This at first sounds like a great idea that should speed up large queries quite a bit. But for one, query time is often bounded not so much by CPU but by I/O, and the sort of analysis that happens for JIT compilation is not free. Not at all.

    I noticed that when a query in the regression test suite I'm running before every commit to DaCHS started to occasionally fail. That test executes:

    SELECT TOP 1 obs_publisher_did
    FROM ivoa.obscore
    WHERE distance(s_ra, s_dec, 83.8,-5.4)<0.2
    

    and then asserts that the result is in within 10 seconds. The purpose of this particular regression test is to make sure all sizable tables in the obscore view have a usable spatial index on the production system. On the development system, there really aren't any tables in obscore that would be slow even when seqscanned.

    How on earth could this query be slow then?

    The natural reaction in such a situation to use EXPLAIN in psql. In this case, there is some non-trivial rewriting of the query going on between ADQL and postgres, which means you cannot just paste the ADQL to Postgres. To figure out the query that DaCHS actually executes, I picked the translated query from the VOTable returned from a successful request (look for the sql_query INFO; that's a DaCHS extension, so that trick won't work for other TAP servers), ran the psql gavo DaCHS operators are probably used to, and then typed:

    EXPLAIN SELECT obs_publisher_did
    FROM ivoa.obscore
    WHERE  q3c_join(83.8, - 5.4, s_ra, s_dec, 0.2) LIMIT 1;
    

    to it. The result was inconspicuous; a few seqscans here and there, but the total cost estimate was “0.00..7.12”, which in physical units works out to “basically nothing”, many orders of magnitude away from the 10 seconds I occasionally saw in the regression tests.

    Well, when a query plan doesn't match your expectations, the next thing to do is EXPLAIN ANALYZE. With that, Postgres executes the plan it has made and then compares its estimates to what the cost turned out to be; this, by the way, is also a good way to find out when you should raise the statistics target of one or more of your columns (see Element Column in the DaCHS reference for details).

    For me, the output looked something like this:

    Limit  (cost=10000000000.00..10156565675.53 rows=1 width=57) (actual time=6206.883..6206.899 rows=1 loops=1)
    [...]
     Planning Time: 22.174 ms
     JIT:
       Functions: 130
       Options: Inlining true, Optimization true, Expressions true, Deforming true
       Timing: Generation 55.404 ms, Inlining 107.280 ms, Optimization 3479.626 ms, Emission 2601.411 ms, Total 6243.721 ms
     Execution Time: 6263.243 ms
    

    Ok, I'm lying a bit; there is another reason than just the analyze for why the cost estimate exploded from 7.12 to 10156565675.53. I'll confess in the appendix to this post.

    The main point, however, is: the execution time now is of the order that I'm expecting (the database is rather busy during a regression test, so those 6 seconds can easily become double that then). Interestingly, essentially all the execution time went into “Optimization” and “Emission”. Until yesterday, I'd never seen a thing like that in Postgres query plans.

    That is because here the JIT is at work, and that was at least a lot less likely in Postgres 11. Now, estimating 10 Gigapennies as execution cost up front, Postgres 13 thought some extra time for writing and compiling a little programme is well spent. Of course, that estimate is badly off, and the right thing to do is to fix the reason for the bad estimate. See the appendix for why I don't just yet.

    That my obscore view has 32 tables contributing to it, giving its definition a whopping 1280 lines, probably does not help. But in particular since the query plans in the presence of Q3C and pgsphere still are usually badly off, it might be wise to discourage Postgres a bit from using JIT compilation with DaCHS' workloads in your configuration if you're running TAP services (you should) and before you upgrade to Postgres 13. To do that, add a:

    jit_above_cost = 20000000000
    

    (or so; perhaps you can set your limit a good deal lower) to your postgresql.conf. On Debian boxes, that file is in /etc/postgresql/13/main/ (obviously, change the 13 if you have a different version). You need to restart postgres to make this take effect.

    While I was in that file, I thought I can share what other configuration I have in there, because it is likely you can speed up your data centre quite a bit by judicious tuning. The following settings aren't particularly well thought out, but I claim they are not unreasonable for a 64 GB machine that runs as a dedicated server; that last thing also causes the first configuration item, as for two-server operation, you have to set

    • listen_addresses = '*' – only then can you talk to postgres from another machine (disregarding hacks like ssh tunnels that may even work as last-resort options). Of course, this may mean your postgres port is visible to the internet, which means you ought to understand what pg_hba.conf is before configuring that. Other configuration I'm doing includes
    • max_connections = 200 – I actually ran out of connections once; DaCHS itself is now a bit more parsimonious with them, but if you have enough RAM, it still doesn't hurt to be generous here.
    • localtime = UTC – TIMESTAMPs suck, because it is hard to compute with them, are a pain when plotting, there are time zones, and they generally are a Babylonian mess (as evinced by base-60 numbers). But you can't always escape timestamps, and if you somehow manage to create them “with time zone”, telling the server to do UTC helps limit their damage radius.
    • shared_buffers = 15GB – the Postgres documentation says 25% of the RAM is a good default for shared_buffers, so that's roughly what I went for here. Note that the kernel usually limits how much shared memory processes are allowed to allocate, and you will have to adjust those limits for this to take effect. On Debian, the postgresql-common package installs a file /etc/sysctl.d/30-postgresql-shm.conf for easy adjusting of the limits.
    • temp_buffers = 100MB – that one gives buffers for temporary tables, and raising it helps TAP uploads (which use those, at least for now). Since our TAP uploads tend to be large as temporary tables go, it pays to set aside a couple of megabytes for them. Now that I look at this again and think about what people upload into my data centre: I think I could even raise that a bit more.
    • work_mem = 64MB – this one is for doing joins and the like (which includes cross-matches), and again these tend to be larger in Astronomy than in many other disciplines, where matching tens-of-millions against billions would count as Big Data. Hence, postgres' default of 4 MB is quite certainly going to be causing a lot of unnecessary disk activity. That said, DaCHS could be a bit smarter here and raise work_mem itself when running TAP jobs (or perhaps only TAP jobs that actually do joins). Note that a single query can use up many times work_mem, which means you shouldn't choose this too high, either. One thing I'd like to look into one day is the hash_mem_multiplier (cf. a bit down on Postgres docs on resource limits). If you do research in that direction with astronomy workloads, please let me know.
    • maintenance_work_mem = 2048MB – this is relevant to keep VACUUM runs fast, which become necessary as rows are added to or replaced in the database. I have some relatively large tables that regularly see deletes (e.g., the relational registry), and hence I want smooth vacuuming. If you don't have large tables that regularly change, you probably don't need to bother with maintenance_work_mem.

    If you have additional (or contradicting) advice on Postgres configuration for DaCHS: Please let us know, preferably on the dachs-support mailing list (see DaCHS support).

    Appendix: As I said: I was lying above. The original with-JIT plan was just fine. The horrible, cost 100 Giga, plan was only chosen when I did the SET enable_seqscan=false. Why would I do a thing like that, forcing Postgres in the wrong direction? Well, DaCHS' TAP executor makes the same setting. And why does it do that to Postgres? That's a long story closely related to the Q3C and pgsphere troubles I've mentioned above – and for which there's now finally hope: See q3c issue #30 if you're curious.

  • Semantics, Cross-Discipline Discovery, and Down-To-Earth Code

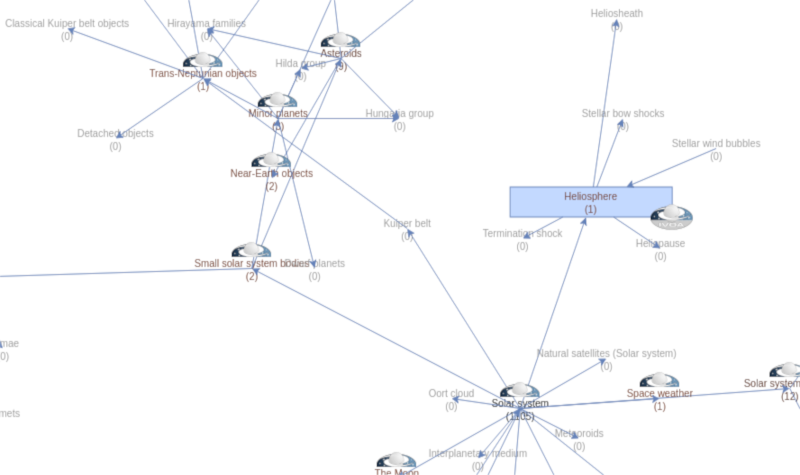
    Boxes-and-arrows view of the UAT

    A tiny piece of the Unified Astronomy Thesaurus as viewed by Sembarebro – the IVOA logos sit on terms that have VO resoures on them.

    Sometimes people ask me (in particular when I'm wearing my hat as the current chair of the IVOA Semantics working group) “well, what's this semantics thing good for?“ There are many answers, but here's one that nicely meshes with my pet subject data discovery: You want hierarchical, agreed-upon word lists to bridge discipline gaps.

    This story starts with B2FIND, a cross-disciplinary metadata aggregator for science data run within the framework of the European Open Science Cloud (EOSC). GAVO (or, more precisely, Heidelberg University's Astronomy) is involved in the EOSC via the ESCAPE project, and so I have had the pleasure of interacting with B2FIND for a while now. In particular, they are harvesting the metadata records of the Virtual Observatory Registry from us.

    This of course requires a bit of mapping, because the VO's metadata formats (VOResource, VODataService, and several extensions; see 2014A&C.....7..101D to learn more) are far too fine-grained for the wider scientific public. Not even our good friends from high-energy physics would appreciate being served links to, say, TAP endpoints (yet!). So, on our end we're mapping to the Datacite metadata kernel, which from VOResource is just a piece of XSL away (plus some perhaps debatable conventions).

    But there's more to this mapping, such as vocabularies of subject keywords. You might argue that in the age of rapid full text searches, keywords are dead. I would beg to disagree. For example, with good, hierarchical keyword systems you can, among many other useful things, offer topical browsing of metadata repositories. While it might not quite qualify as “useful” yet, the SemBaReBro registry browser I've hacked together late last year would be an example for such facilities – and might become part of our WIRR Registry searching tool one day.

    On the topic of subject keywords VOResource says that resources in the VO should be using the Unified Astronomy Thesaurus, specifically in its IVOA incarnation (not quite true yet, but true enough by blog standards). While few do, I've done a mapping of existing keywords in the VO to UAT concepts, which is what's behind SemBaReBro. So: most VO resources now have UAT concepts.

    However, these include concepts like AM Canum Venaticorum Stars, which outside of rather specialised circles of astronomers few people will ever have heard about (which, don't get me wrong, I personally regret – they're funky star systems). Hence, B2FIND does not bother with those.

    When we discussed the subject mapping for B2FIND, we thought using the UAT's top-level concepts might be a good start. However, at that point no VO resources at all actually used these, and, indeed, within astronomy that generally wouldn't make a lot of sense, because they are to unspecific to help much within the discipline. I postponed and then forgot about the problem – when the keywords of the resources weren't even from UAT, solving the granularity mismatch just wasn't humanly possible.

    That was the state of affairs until last Tuesday, when I had a mumble session with B2FIND folks and the topic came up again. And now, thanks partly to the new desise format proposed in the current Vocabularies in the VO 2 draft, things fell nicely into place: Hey, I have UAT concepts, and mapping these to the top-level terms isn't hard either any more.

    So, B2FIND gets the toplevel keywords they've been expecting all the time starting today. Yes: This isn't a panacea suddenly solving all the problems of cross-discipline data discovery, not the least because it's harder than one might think to imagine how such a thing would look like in practice. But given the complexities involved I was positively surprised how easy this particular part of the equation was.

    From here on, there's a bit of tech babble I intend to re-use in the RFC of Vocabularies in the VO 2; don't feel bad if you skip it.

    The first step was to make the mapping from UAT terms to the toplevel terms. The interesting part of the source I'm linking to here is:

    def get_roots_for(term, uat_terms):
      roots, seen = set(), set()
    
      def follow(t):
        wider = uat_terms[t]["wider"]
        if not wider:
          if not t in ROOT_TERMS:
            raise Exception(
              f"{t} found as a top-level term")
          roots.add(t)
        else:
          seen.add(t)
          for wider in uat_terms[t]["wider"]:
            follow(wider)
    
      follow(term)
      return roots
    

    There, uat_terms is essentially just a json-decode of what you get from the vocabulary URI if you ask for desise (see the draft spec linked to above for the technicalities). That's really it, and it even defends against cycles in the concept graph (which are legal by SKOS but shouldn't happen in the UAT) and detached terms (i.e., ones that are not rooted in the top-level terms). For what it does, I claim that's remarkably compact code.

    Once I had that, I needed to get the UAT-mapped subject keywords for the records I'm serving to datacite and fiddle the corresponding roots back in. That's technically a bit more involved because I am producing the datacite records on the fly from the XML representation for VOResource records that I keep in the database, and there's a bit of namespace magic involved (full code). Plus, the UAT-mapped keywords are only kept in the database, not in the metadata records.

    Still, the core operation here is relatively straightforward. Consider:

    def addUATToplevels(dataciteTree):
      # dataciteTree is an (lxml) ElementTree for the
      # result of the XSL transformation.  That's all
      # I have, and thus I first have to fiddle out
      # the identifier we are talking about
      ivoid =  dataciteTree.xpath(
          "//d:alternateIdentifier["
          "@alternateIdentifierType='ivoid']",
          namespaces={"d": DATACITE_NS}
        )[0].text.lower()
      # The .lower() is necessary because ivoids
      # unfortunately are case-insensitive, and RegTAP
      # normalises them to lowercase to retain sanity.
    
      # Now pull the UAT-mapped subject keywords from
      # our RegTAP extension (getTableConn is
      # DaCHS-internal API, but there's no magic in
      # there, it's just connection pooling with
      # guarantees against connections  idle in
      # transaction).
      with base.getTableConn() as conn:
        subjects = set(r[0] for r in
          conn.query("SELECT uat_concept"
            " FROM rr.subject_uat"
            " WHERE ivoid=%(ivoid)s", locals()))
    
      # This is the mapping itself: we do
      # roots-subjects to avoid adding
      # root terms that are already in
      # the record itself.  UAT_TOPLEVELS is the result
      # of the root finding discussed above.
      for term in subjects:
        root = UAT_TOPLEVELS[term]
        newRoots |= (root-subjects)
    
      # And finally fiddle in any new root terms found
      # into the datacite tree
      if newRoots:
        subjects = dataciteTree.xpath(
          "//d:subjects",
          namespaces={"d": DATACITE_NS})[0]
        for root in newRoots:
          newSubject = etree.SubElement(subjects,
            f"{{{DATACITE_NS}}}subject")
          newSubject.text = root
    

    Apart from the technicalities I'd again say that's pretty satisfying code.

    And these two pieces of code are really all I had to do to map between the vocabularies of different granularities – which I claim will probably be the norm as metadata flows between disciplines.

    It's great to see the pieces of a fairly comples puzzle fall into place like that.

  • The Case of the Disappearing Bits

    [number line with location markers]

    Every green line in this image stands for a value exactly representable in a floating point value of finite size. As you see, it's a white area out there [source]

    While I was preparing the publication of Coryn Bailer-Jones' distance estimations based on Gaia eDR3 (to be released about tomorrow), Coryn noticed I was swallowing digits from his numbers. My usual reaction of “aw, these are meaningless anyway because your errors are at least an order of magnitude higher” didn't work this time, because Gaia is such an incredible machine that some of the values really have six significant decimal digits. For an astronomical distance! If I had a time machine, I'd go back to F.W. Bessel right away to make him pale in envy.

    I'm storing these distances as PostgreSQL REALs, so these six digits are perilously close the seven decimal digits that the 23 bits of mantissa of single precision IEEE 754 floats are usually translated to. Suddenly, being cavalier with the last few bits of the mantissa isn't just a venial sin. It will lose science.

    So, I went hunting for the bits, going from parsing (in this case C's sscanf) through my serialisation into Postgres binary copy material (DaCHS operators: this is using a booster) to pulling the material out of the database again. And there I hit it: the bits disappeared between copying them in and retrieving them from the database.

    Wow. Turns out: It's a feature. And one I should have been aware of in that Postgres' docs have a prominent warning box where it explains its floating point types: Without setting extra-float-digits it will cut off bits. And it's done this ever since the dawn of DaCHS (in postgres terms, version 8.2 or so).

    Sure enough (edited for brevity):

    gavo=$ select r_med_geo from gedr3dist.main
    gavo-$ where source_id=563018673253120;
        1430.9
    
    gavo=$ set extra_float_digits=3;
    gavo=$ select r_med_geo from gedr3dist.main
    gavo-$ where source_id=563018673253120;
     1430.90332
    

    Starting with its database schema 26 (which is the second part of the output of dachs --version), DaCHS will configure its database roles always have extra_float_digits 3; operators beware: this may break your regression tests after the next upgrade.

    If you want to configure your non-DaCHS role, too, all it takes is:

    alter role (you) set extra_float_digits=3,
    

    You could also make the entire database or even the entire cluster behave like that; but then losing these bits isn't always a bad idea: It really makes the floats prettier while most of the time not losing significant data. It's just when you want to preserve the floats as you get them – and with science data, that's mostly a good idea – that we just can't really afford that prettyness.

    Update (2021-04-22): It turns out that this was already wrong (for some meaning of wrong) when I wrote this. Since PostgreSQL 12, Postgres uses shortest-precise by default (and whenever extra_float_digits is positive). The official documentation has a nice summary of the problem and the way post-12 postgres addresses it. So: expect your float-literal-comparing regression tests to break after the upgrade to bullseye.

  • GAVO vs. Corona

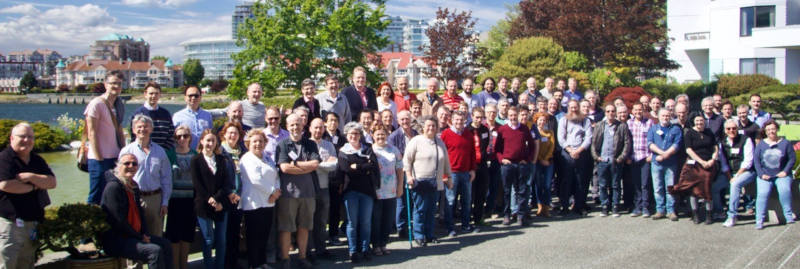
    A conference group photo

    You won't see something like this (the May 2018 Interop group photo) in Spring 2020: The Sidney Interop, planned for early May, is going to take place using remote tools. Some of which I'd rather do without.

    The Corona pandemic, regrettably, has also brought with it a dramatic move to closed, proprietary communication and collaboration platforms: I'm being bombarded by requests to join Zoom meetings, edit Google docs, chat on Slack, “stream” something on any of Youtube, Facebook, Instagram, or Sauron (I've made one of these up).

    Mind you, that's within the Virtual Observatory. Call me pig-headed, but I feel that's a disgrace when we're out to establish Free and open standards (for good reasons). To pick a particularly sad case, Slack right now is my pet peeve because they first had an interface to IRC (which has been doing what they do since the late 80ies, though perhaps not as prettily in a web browser) and then cut it when they had sufficient lock-in. Of course, remembering how Google first had XMPP (that's the interoperable standard for instant messaging) in Google talk and then cut that, too... ah well, going proprietary unfortunately is just good business sense once you have sufficient lock-in.

    Be that as it may, I was finally fed up with all this proprietary tech and set up something suitable for conferecing building on open, self-hostable components. It's on https://telco.g-vo.org, and you're welcome to use it for your telecons (assuming that when you're reading this blog, you have at least some relationship to astronomy and open standards).

    What's in there?

    Unfortunately, there doesn't seem to be an established, Free conferencing system based on SIP/RTP, which I consider the standard for voice communication on the internet (if you've never heard of it: it's what your landline phone uses in all likelihood). That came as a bit of a surprise to me, but the next best thing is a Free and multiply implemented solution, and there's the great mumble system that (at least for me) works so much better than all the browser-based horrors, not to mention it's quite a bit more bandwidth-effective. So: Get a client and connect to telco.g-vo.org. Join one of the two meeting rooms, done.

    Mumble doesn't have video, which, considering I've seen enough of peoples' living rooms (not to mention Zoom's silly bluebox backgrounds) to last a lifetime, counts as an advantage in my book. However, being able to share a view on a document (or slide set) and point around in it is a valid use case. Bonus points if the solution to that does not involve looking at other people's mail, IM notifications, or screen backgrounds.

    Now, a quick web search did not turn up anything acceptable to me, and since I've always wanted to play with websockets, I've created poatmyp: With it, you upload a PDF, distribute the link to your meeting partners, and all participants will see the slides and a shared pointer. And they can move around in the document together.

    What's left is shared editing. I've looked at a few implementations of this, but, frankly, there's too much npm and the related curlbashware in this field to make any of it enjoyable; also, it seems nobody has bothered to provide a Debian package of one of the systems. On the other hand, there are a few trustworthy operators of etherpads out there, so for now we are pointing to them on telco.g-vo.

    Setting up a mumble server and poatmyp isn't much work if you know how to configure an nginx and have a suitable box on the web. So: perhaps you'll use this opportunity to re-gain a bit of self-reliance? You see, there's little point to have your local copy of the Gaia catalogue, and doing that right is hard. Thanks to people writing Free software, running a simple telecon infrastructure, on the other hand, isn't hard any more.

  • Parallel Queries

    Image: Plot of run times

    An experiment with parallel querying of PPMX, going from single-threaded execution to using seven workers.

    Let me start this post with a TL;DR for

    scientists:
    Large analysis queries (like those that contain a GROUP BY clause) profit a lot from parallel execution, and you needn't do a thing for that.
    DaCHS operators:
    When you have large tables, Postgres 11 together with the next DaCHS release may speed up your responses quite dramatically in some cases.

    So, here's the story –

    I've finally overcome my stretch trauma and upgraded the Heidelberg data center's database server to Debian buster. With that, I got Postgres 11, and I finally bothered to look into what it takes to enable parallel execution of database queries.

    Turns out: My Postgres started to do parallel execution right away, but just in case, I went for the following lines in postgresql.conf:

    max_parallel_workers_per_gather = 4
    max_worker_processes = 10
    max_parallel_workers = 10
    

    Don't quote me on this – I frankly admit I haven't really developed a feeling for the consequences of max_parallel_workers_per_gather and instead just did some experiments while the box was loaded otherwise, determining where raising that number has a diminishing return (see below for more on this).

    The max_worker_processes thing, on the other hand, is an educated guess: on my data center, there's essentially never more than one person at a time who's running “interesting”, long-running queries (i.e., async), and that person should get the majority of the execution units (the box has 8 physical CPUs that look like 16 cores due to hyperthreading) because all other operations are just peanuts in comparison. I'll gladly accept advice to the effect that that guess isn't that educated after all.

    Of course, that wasn't nearly enough. You see, since TAP queries can return rather large result sets – on the GAVO data center, the match limit is 16 million rows, which for a moderate row size of 2 kB already translates to 32 GB of memory use if pulled in at once, half the physical memory of that box –, DaCHS uses cursors (if you're a psycopg2 person: named cursors) to stream results and write them out to disk as they come in.

    Sadly, postgres won't do parallel plans if it thinks people will discard a large part of the result anyway, and it thinks that if you're coming through a cursor. So, in SVN revision 7370 of DaCHS (and I'm not sure if I'll release that in this form), I'm introducing a horrible hack that, right now, just checks if there's a literal “group” in the query and doesn't use a cursor if so. The logic is, roughly: With GROUP, the result set probably isn't all that large, so streaming isn't that important. At the same time, this type of query is probably going to profit from parallel execution much more than your boring sequential scan.

    This gives rather impressive speed gains. Consider this example (of course, it's selected to be extreme):

    import contextlib
    import pyvo
    import time
    
    @contextlib.contextmanager
    def timeit(activity):
      start_time = time.time()
      yield
      end_time = time.time()
      print("Time spent on {}: {} s".format(activity, end_time-start_time))
    
    
    svc = pyvo.tap.TAPService("http://dc.g-vo.org/tap")
    with timeit("Cold (?) run"):
      svc.run_sync("select round(Rmag) as bin, count(*) as n"
        " from ppmx.data group by bin")
    with timeit("Warm run"):
      svc.run_sync("select round(Rmag) as bin, count(*) as n"
        " from ppmx.data group by bin")
    

    (if you run it yourself and you get warnings about VOTable versions from astropy, ignore them; I'm right and astropy is wrong).

    Before enabling parallel execution, this was 14.5 seconds on a warm run, after, it was 2.5 seconds. That's an almost than a 6-fold speedup. Nice!

    Indeed, that holds beyond toy examples. The showcase Gaia density plot:

    SELECT
            count(*) AS obs,
            source_id/140737488355328 AS hpx
    FROM gaia.dr2light
    GROUP BY hpx
    

    (the long odd number is 235416-6, which turns source_ids into level 6-HEALPixes as per Gaia footnote id; please note that Postgres right now isn't smart enough to parallelise ivo_healpix), which traditionally ran for about an hour is now done in less than 10 minutes.

    In case you'd like to try things out on your postgres, here's what I've done to establish the max_parallel_workers_per_gather value above.

    1. Find a table with a few 1e7 rows. Think of a query that will return a small result set in order to not confuse the measurements by excessive client I/O. In my case, that's a magnitude histogram, and the query would be:

      select round(Rmag) as bin, count(*) as n from ppmx.data group by bin;

      Run this query once so the data is in the disk cache (the query is “warm”).

    2. Establish a non-parallel baseline. That's easy to do:

      set max_parallel_workers_per_gather=0;
      
    3. Then run:

      explain analyze select round(Rmag) as bin, count(*) as n from ppmx.data group by bin;
      

      You should see a simple query plan with the runtime for the non-parallel execution – in my case, a bit more than 12 seconds.

    4. Then raise the number of max_parallel_workers_per_gatherer successively. Make sure the query plan has lines of the form “Workers Planned” or so. You should see that the execution time falls with the number of workers you give it, up to the value of max_worker_processes – or until postgres decides your table is too small to warrant further parallelisation, which for my settings happened at 7.

    Note, though, that in realistic, more complex queries, there will probably be multiple operations that will profit from parallelisation in a single query. So, if in this trivial example you can go to 15 gatherers and still see an improvement, this could actually make things slower for complex queries. But as I said above: I have no instinct yet for how things will actually work out. If you have experiences to share: I'm sure I'm not the only person on dachs-users who't be interested.

    Update 2022-05-17: In Postgres 13, I found that the planner disfavours parallel plans a lot stronger than I think it has in Postgres 11. To make up for that, I've amended my postgres configuration (in /etc/postgresql/13/main/postgresql.conf) with the slightly bizarre:

    parallel_tuple_cost = 0.001
    parallel_setup_cost = 3
    

    This is certainly not ideal for every workload, but given the queries I see in the VO I want to give Postgres no excuse not to parallelise when there is at least the shard of a chance it'll help; given I'll never execute more than very few queries per second, the extra overhead for parallelising queries that would be faster sequentially will never really bite me.

« Page 2 / 4 »