Deredden using TAP

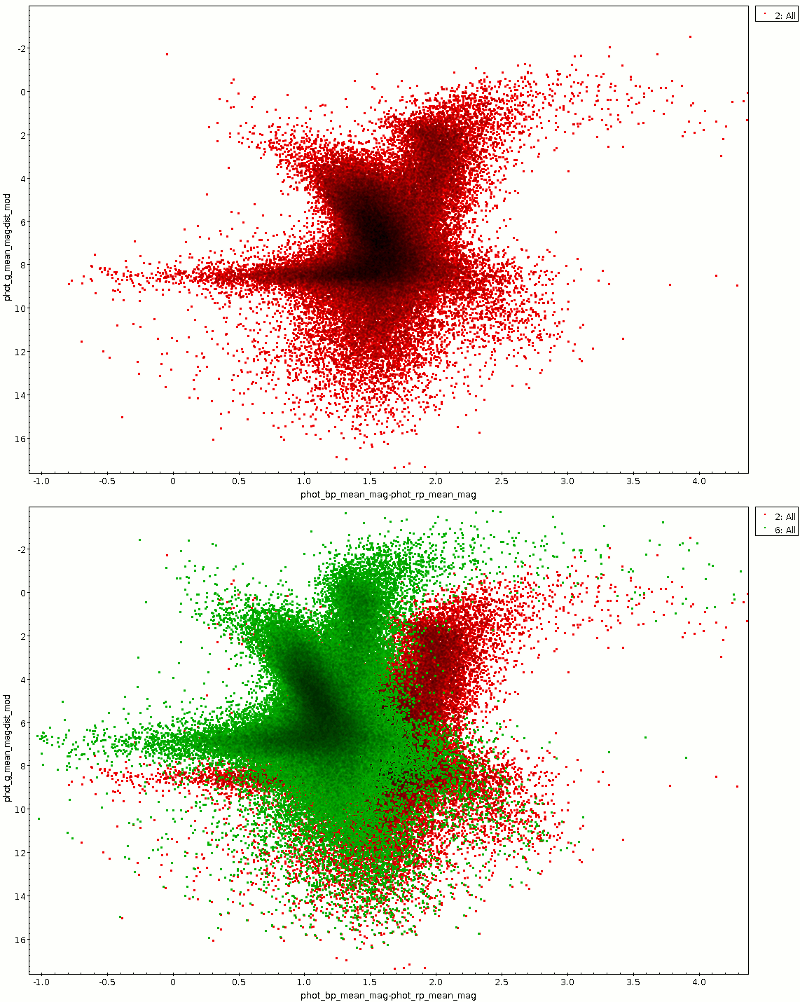
Raw and dereddened CMD for a region in Cygnus.
Today I published a nice new set of tables on our TAP service: The Bayestar17 3D dust map derived from Pan-STARRS 1 by Greg Green et al. I mention in passing that this was made particularly enjoyable because Greg and friends put an explicit license on their data (in this case, CC-BY-SA).
This dust map is probably a fascinating resource by itself, but the really nifty thing is that you can use it to correct all kinds of photometric data for extinction – at least to some extent. On the Bayestar web page, the authors give some examples for usage – and with our new service, you can use TAP as well to correct photometry for extinction.
To see how, first have a look at the table metadata for the prdust.map_union table; this is what casual users probably should look at. More specifically, at the coverage, best_fit, and grdiagnostic columns.
coverage here is an interval of 10-healpixes. It has to be an interval because the orginal data comes on wildly different levels; depending on the density of stars, sometimes it takes the area of a 6-healpix (about a square degree) to get enough signal, whereas in the galactic plane a 10-healpix (a thousandth of a square degree) already has enough stars. To make the whole thing conveniently queriable without exploding a 6-healpix row into 1000 identical rows, larger healpixes translate into intervals of 10-helpixes. Don't panic, though, I'll show how to conveniently query this below.
best_fit and grdiagnostic are arrays (remember the light cuves in Gaia DR2?). In bins of 0.5 in distance modulus (which is, in case you feel a bit uncertain as to the algebraic signs, 5 log10(dist)-5 for a distance in parsec), starting with a distance modulus of 4 and ending with 19. This means that for a distance modulus of 4.2 you should check the array index 0, whereas 4.3 already would be covered by array index 1. With this, best_fit[ind] gives E(B-V) = (B-V) - (B-V)0 in the direction of coverage in a distance modulus bin of 2*ind+4. For each best_fit[ind], grdiagnostic[ind] contains a quality measure for that value. You probably shouldn't touch the E(B-V) if that measure is larger than 1.2.
So, how does one use this?
To try things, let's pull some Gaia data with distances; in order to have interesting extinctions, I'm using a patch in Cygnus (RA 288.5, Dec 2.3). If you live on the northern hemisphere and step out tonight, you could see dust clouds there with the naked eye (provided electricity fails all around, that is). Full disclosure: I tried the Coal Sack first but after checking the coverage of the dataset – which essentially is the sky north of -30 degrees – I noticed that wouldn't fly. But stories like these are one reason why I'm making such a fuss about having standard STC coverage representations.
We want distances, and to dodge all the intricacies involved when naively turning parallaxes to distances discussed at length in a paper by Xavier Luri et al (and elsewhere), I'm using precomputed distances from Bailer-Jones et al. (2018AJ....156...58B); you'll find them on the "ARI Gaia" service; in TOPCAT's TAP dialog simply search for “Gaia” – that'll give you the GAVO DC TAP search, too, and that we'll need in a second.
The pre-computed distances are in the gaiadr2_complements.geometric_distance table, which can be joined to the main Gaia object catalog using the source_id column. So, here's a query to produce a little photometric catalog around our spot in Cygnus (we're discarding objects with excessive parallax errors while we're at it):
SELECT
r_est, 5*log10(r_est)-5 as dist_mod,
phot_g_mean_mag, phot_bp_mean_mag, phot_rp_mean_mag,
ra, dec
FROM
gaiadr2.gaia_source
JOIN gaiadr2_complements.geometric_distance
USING (source_id)
WHERE
parallax_over_error>1
AND 1=CONTAINS(POINT('ICRS', ra, dec), CIRCLE('ICRS', 288.5, 2.3, 0.5 ))
The color-magnitude diagram resulting from this is the red point cloud in the animated GIF at the top. To reproduce it, just plot phot_bp_mean_mag-phot_rp_mean_mag against phot_g_mean_mag-dist_mod (and invert the y axis).
De-reddening this needs a few minor technicalities. The most important one is how to match against the odd intervals of healpixes in the prdust.map_union table. A secondary one is that we have only pulled equatorial coordinates, and the healpixes in prdust are in galactic coordinates.
Computing the healpix requires the ivo_healpix_index ADQL user defined function (UDF) that you may have met before, and since we have to go from ICRS to Galactic it requires a fairly new UDF I've recently defined to finally get the discussion on having a “standard library” of astrometric functions in ADQL going: gavo_transform. Here's how to get a 10-healpix as required for map_union from ra and dec:
CAST(ivo_healpix_index(10,
  gavo_transform('ICRS', 'GALACTIC', POINT(ra, dec))) AS INTEGER)
The CAST call is a pure technicality – ivo_healpix_index returns a 64-bit integer, which I can't use in my interval logic.
The comparison against the intervals you could do yourself, but as argued in Registry-STC article this is one of the trivial things that are easy to get wrong. So, let's use the ivo_interval_overlaps UDF; it goes in the join condition to properly match prdust healpixes to catalog positions. Then our total query – that, I hope, should be reasonably easy to adapt to similar problems – is:
WITH sources AS (
  SELECT phot_g_mean_mag,
    phot_bp_mean_mag,
    phot_rp_mean_mag,
    dist_mod,
    CAST(ivo_healpix_index(10,
      gavo_transform('ICRS', 'GALACTIC', POINT(ra, dec))) AS INTEGER) AS hpx,
    ROUND((dist_mod-4)*2)+1 AS dist_mod_bin
  FROM TAP_UPLOAD.T1)

SELECT
  phot_bp_mean_mag-phot_rp_mean_mag-dust.best_fit[dist_mod_bin] AS color,
  phot_g_mean_mag-dist_mod+
    dust.best_fit[dist_mod_bin]*3.384 AS abs_mag,
  dust.grdiagnostic[dist_mod_bin] as qual
FROM sources
JOIN prdust.map_union AS dust
ON (1=ivo_interval_has(hpx, coverage))
(If you're following along: you have to switch to the GAVO DC TAP to run this, and you will probably have to change the index after TAP_UPLOAD).
Ok, in the photometry department there's a bit of cheating going on here – I'm correcting Gaia B-R with B-V, and I'm using the factor for Johnson V to estimate the extinction in Gaia G (if you're curious where that comes from: See the footnote on best_fit and the MC extinction service docs should get you started), so this is far from physically correct. But, as you can see from the green cloud in the plot above, it already helps a bit. And if you find out better factors, by all means let me know so I can add an update... right here:
Update (2018-09-11): The original data creator, Gregory Green points out that the thing with having a better factor for Gaia G isn't that simple, because, as he says “Gaia G is very broad, [and] the extinction coefficients are much more dependent on stellar type, and extinction is also more nonlinear with dust column (extinction is only linear with dust column and independent of stellar type for an infinitely narrow passband)”. So – when de-reddening, prefer narrow passbands. But whether narrow or wide: TAP helps you.

![[RSS]](../theme/image/rss.png)

